Next project
Opportune Financial Advisors was founded in 2006 by a group of tax and corporate finance specialists. After working as executives at large corporations for more than 30 years, they identified an unmet need that major auditing and consulting firms were not addressing.
In addition to providing consulting services, they created a platform now known as AUDIT — Financial Auditor, which provides custom reports and financial performance analysis for managers and financial auditors.
Opportune provides services for:
Small and medium-sized businesses with revenue starting at 250,000;
Companies looking for a strategy-focused solution;
Managers, business owners, and companies struggling to manage their financial operations;
Value proposition
To provide a better user experience, the platform needed clear differentiators and solutions for problems customers faced when using competing products.
Provide both high-level and detailed views of the company’s financial data;
Provide charts for analyzing overdue payments, cash flow, installment plans, and bank balances;
Have auditors continuously monitor the data to ensure the accuracy of the figures presented in the system;
“Our product solves a common business problem: understanding what is actually happening with the company’s finances. This includes confirming whether the reported results and cash flow are correct and analyzing installment plans and overdue payments. We simplify the company’s financial view through a dashboard made by people.” — Vitor Hugo, Partner at Opportune
Key challenges
The main issues with the existing product were:
Poor data scannability;
Lack of visual consistency;
Too much information without a clear hierarchy;
Difficulty reading charts and tables;
An unintuitive experience for non-technical users;
“The current portal does not communicate trust or credibility to our clients.” — Vitor Hugo, Partner at Opportune
Previous sitemap
We mapped the structure and flows of the existing system to understand the overall experience and identify opportunities for improvement.
The previous system had two main flows:
User/manager, analyst, accountant, or auditor: access to reports, tables, and charts for data analysis.
Administrator/Consultant: extended access with permissions to manage the system and edit information.

At this stage, I developed the initial structure into mid-fidelity wireframes. The goal was to validate the information architecture and visual hierarchy before applying the visual design.
The main focus was turning complex data into a clear, scannable structure that supported decision-making.
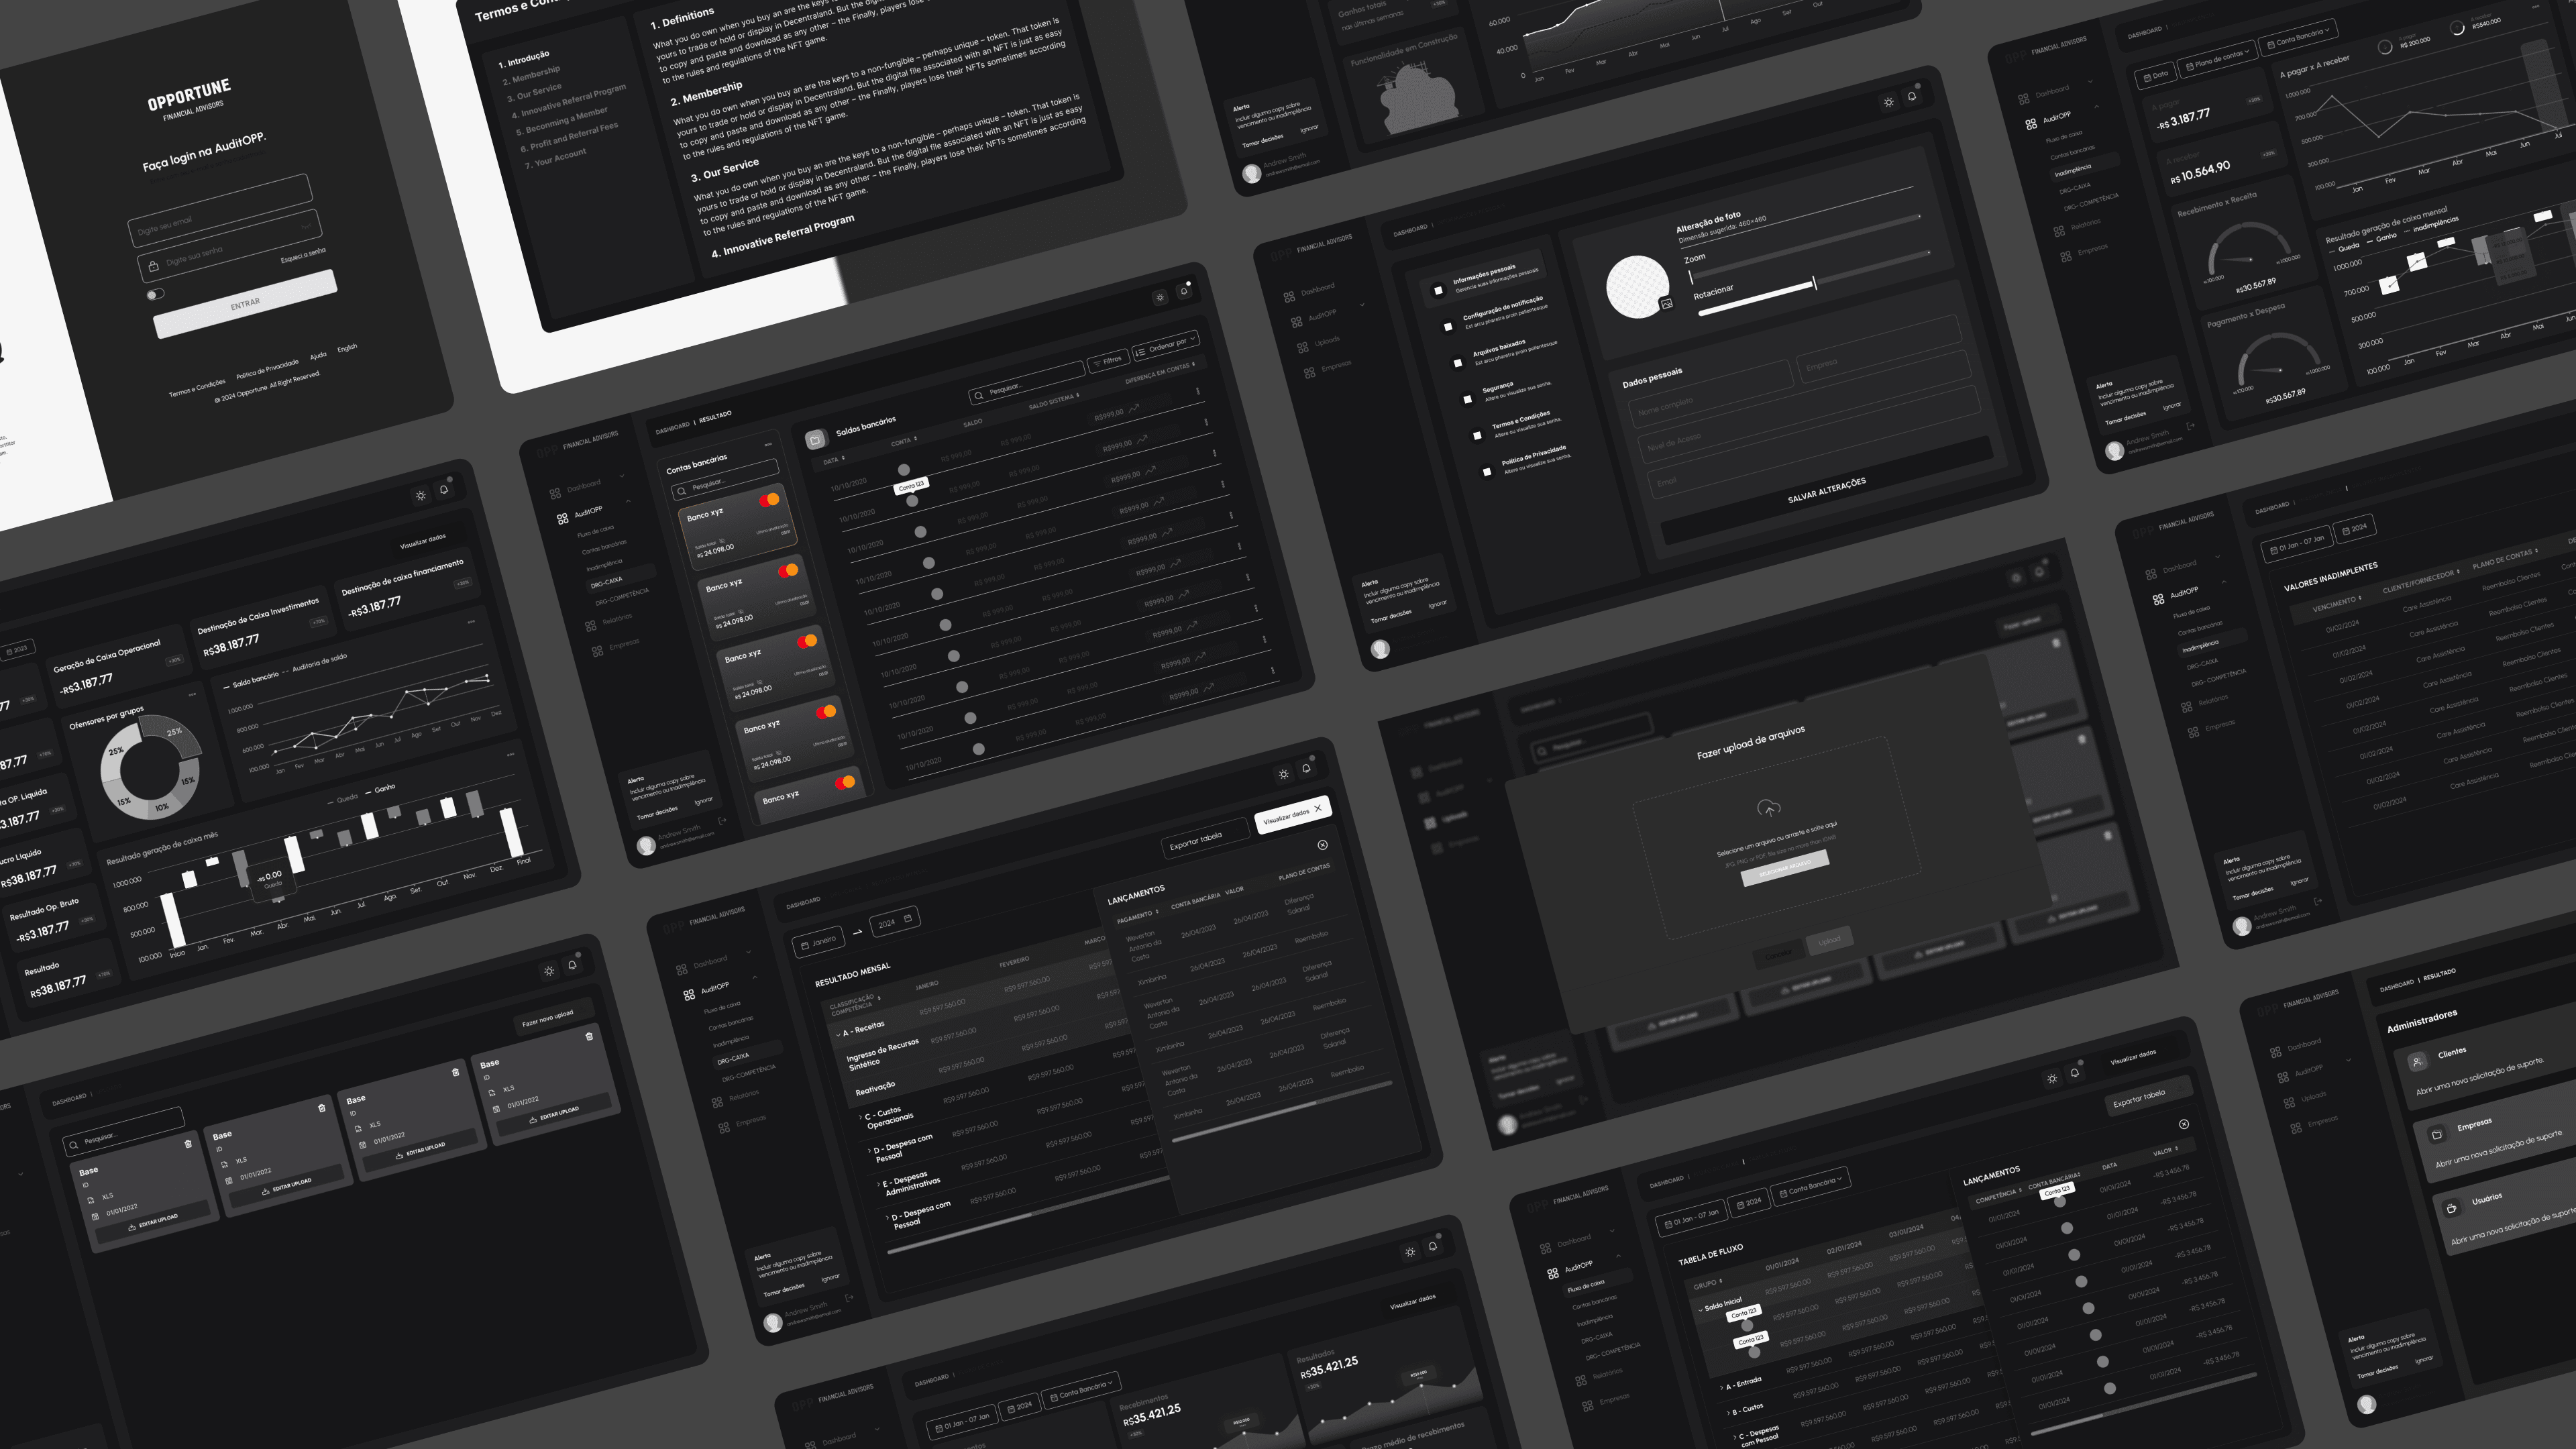
Since we did not have access to the system’s second user group—Opportune’s clients—we focused on the challenges faced by Opportune’s auditors, who were responsible for auditing the client companies.

Previous screen

Redesigned screen
Cards lacked consistency and a clear purpose
Charts were difficult to read
The lack of a consistent visual hierarchy made the interface confusing
Information was difficult to scan
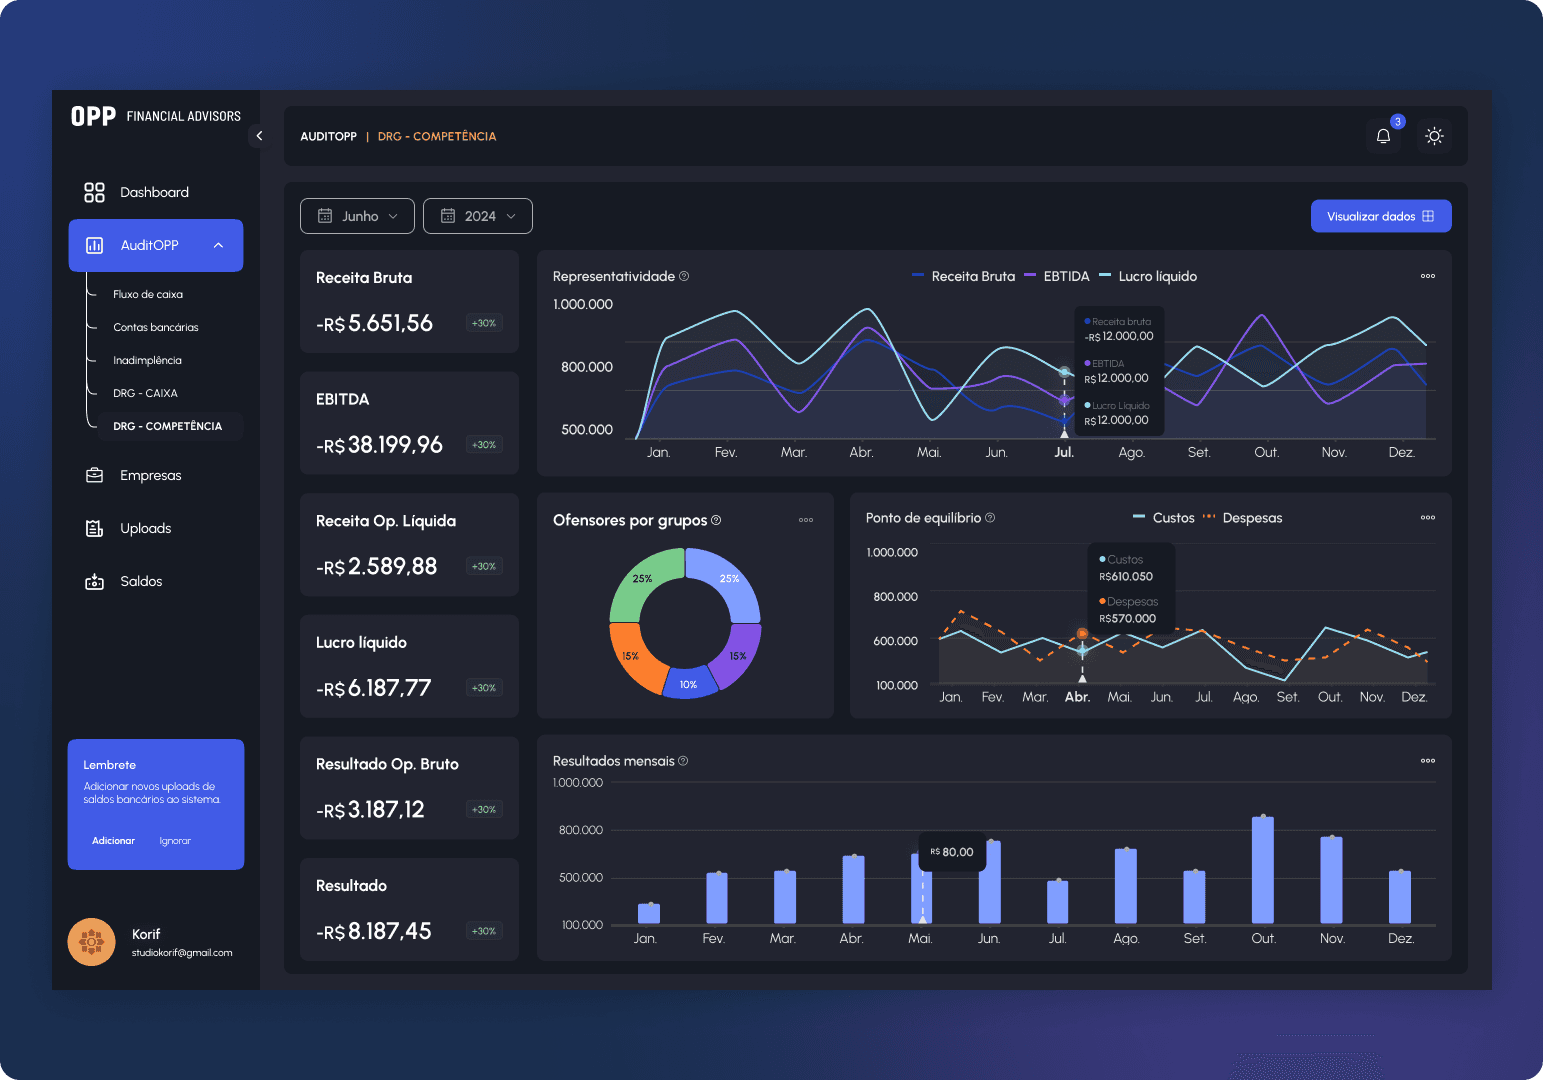
Cards now have a clear purpose and focus on the selected context
Charts display broader time ranges, making high-level analysis easier
A more organized visual structure prioritizes the most relevant information
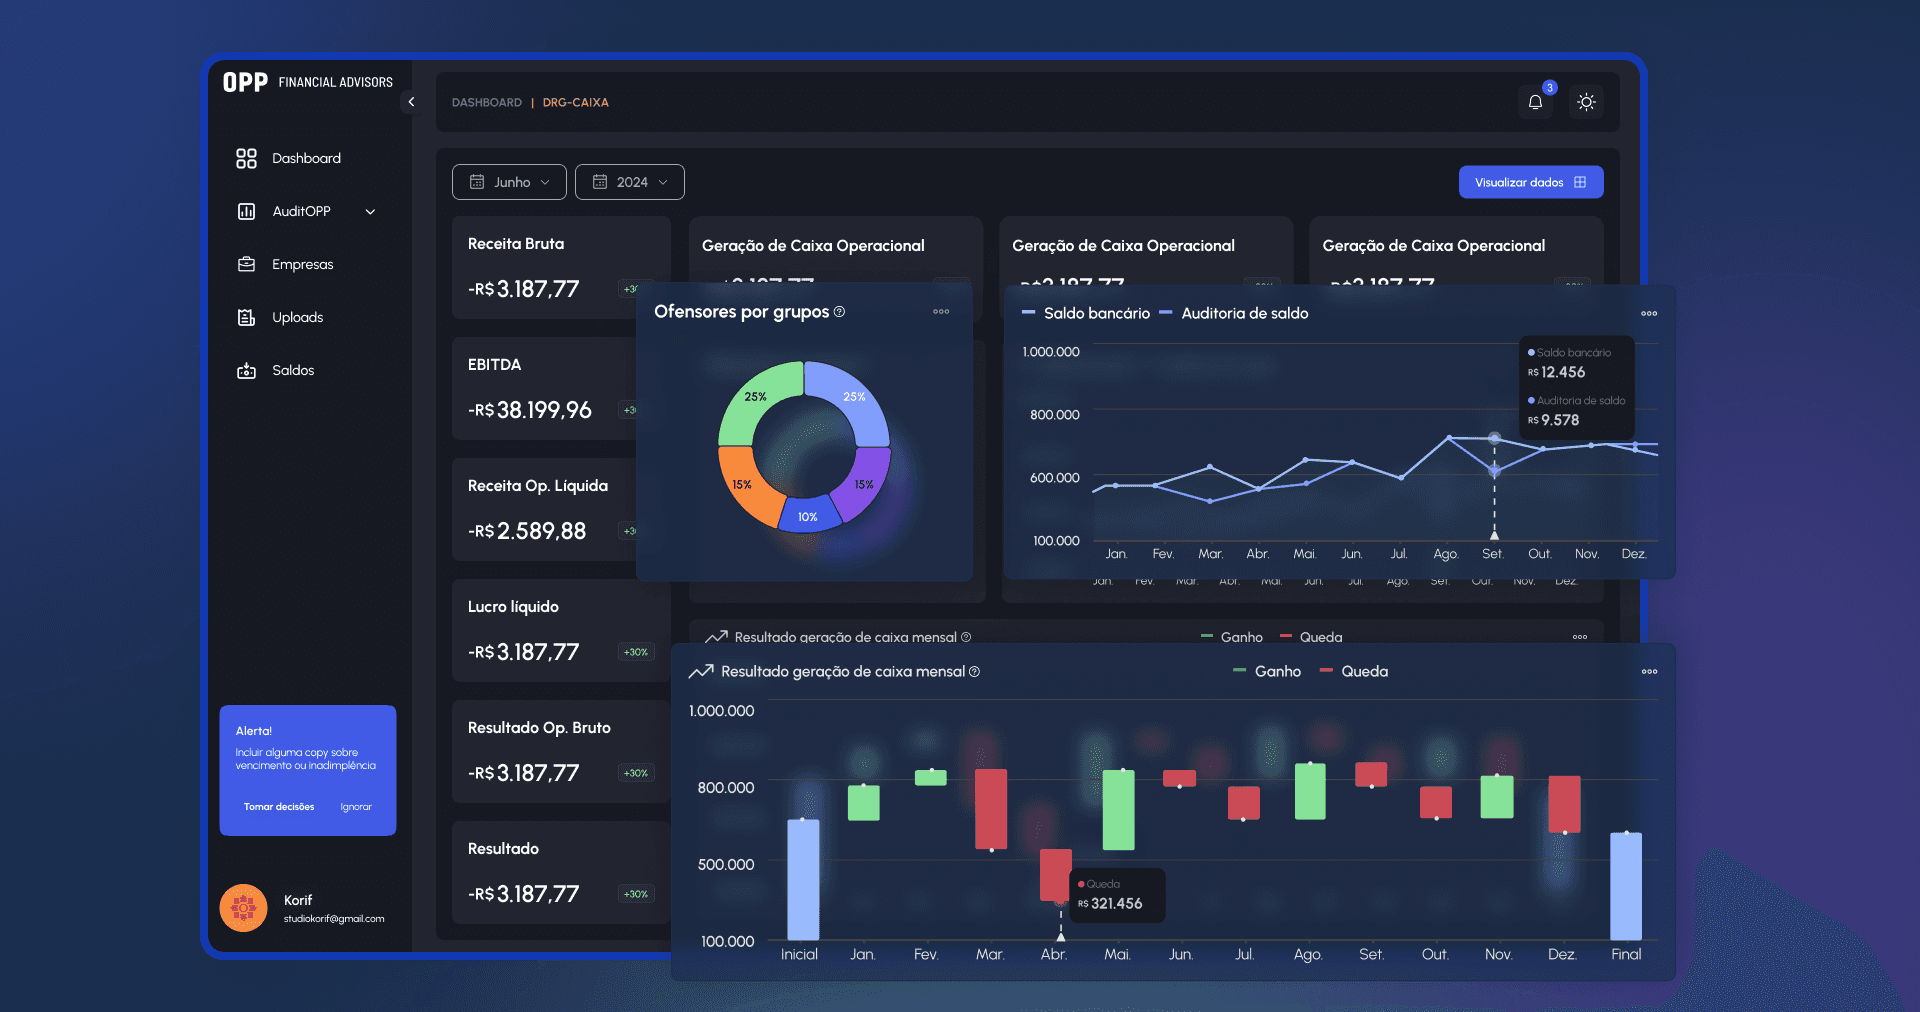
To improve the user experience, every chart includes a tooltip next to its legend explaining the purpose of the visualization.
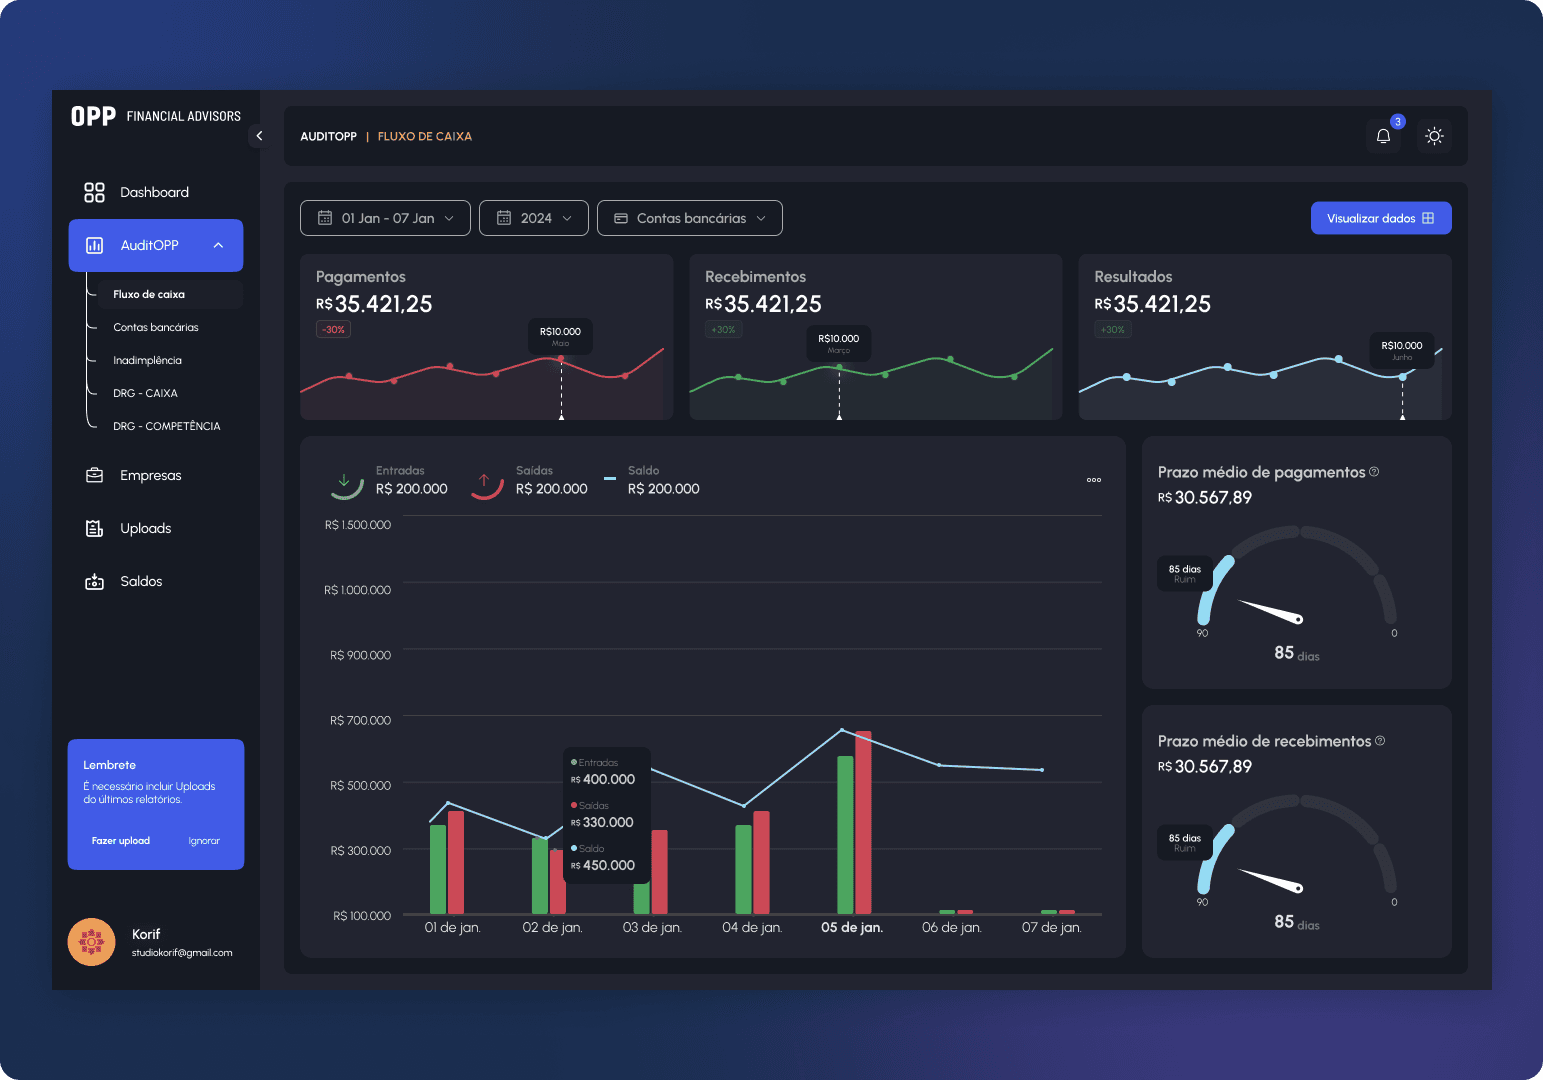
Previously, the information was difficult to follow because too much data appeared on the same screen. In the redesign, I organized the main indicators into cards and charts, making them faster and easier to understand.
This structure helps users understand data such as revenue, cash generation, operating results, bank balances, and month-to-month changes. The goal was to turn a screen filled with numbers into a more visual and understandable experience.
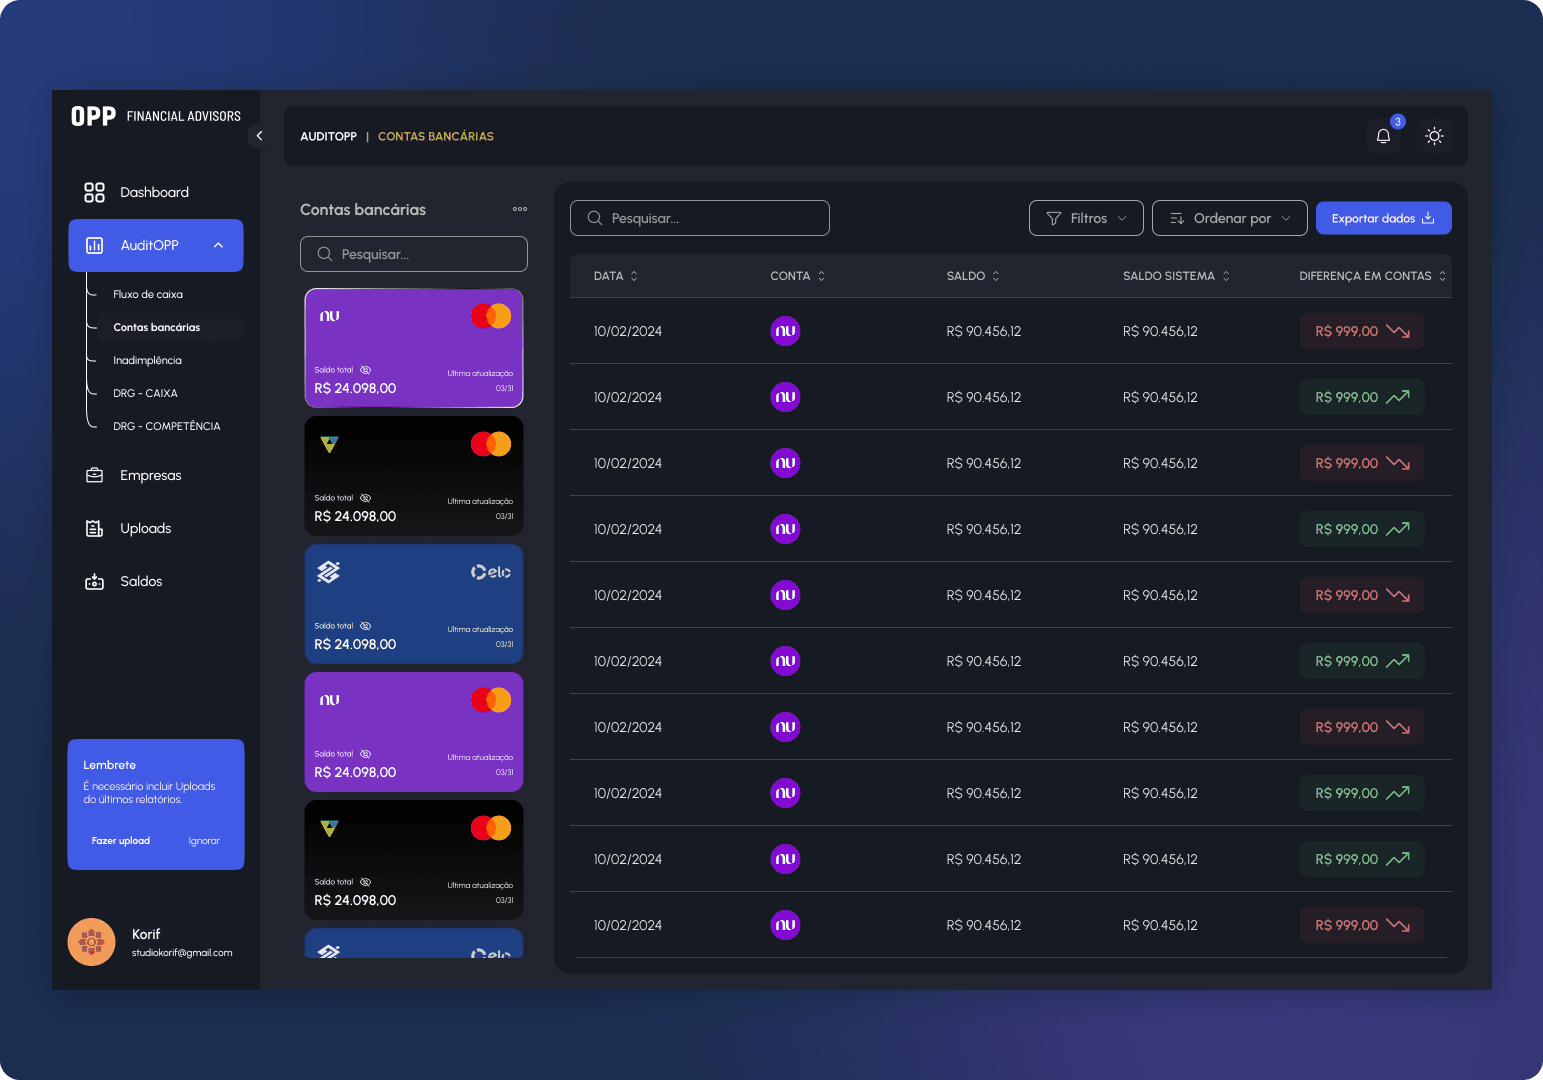
Detailed data was moved to a dedicated area accessed through the “View data” button. This keeps the main screen cleaner and focused on what matters most for a quick analysis.
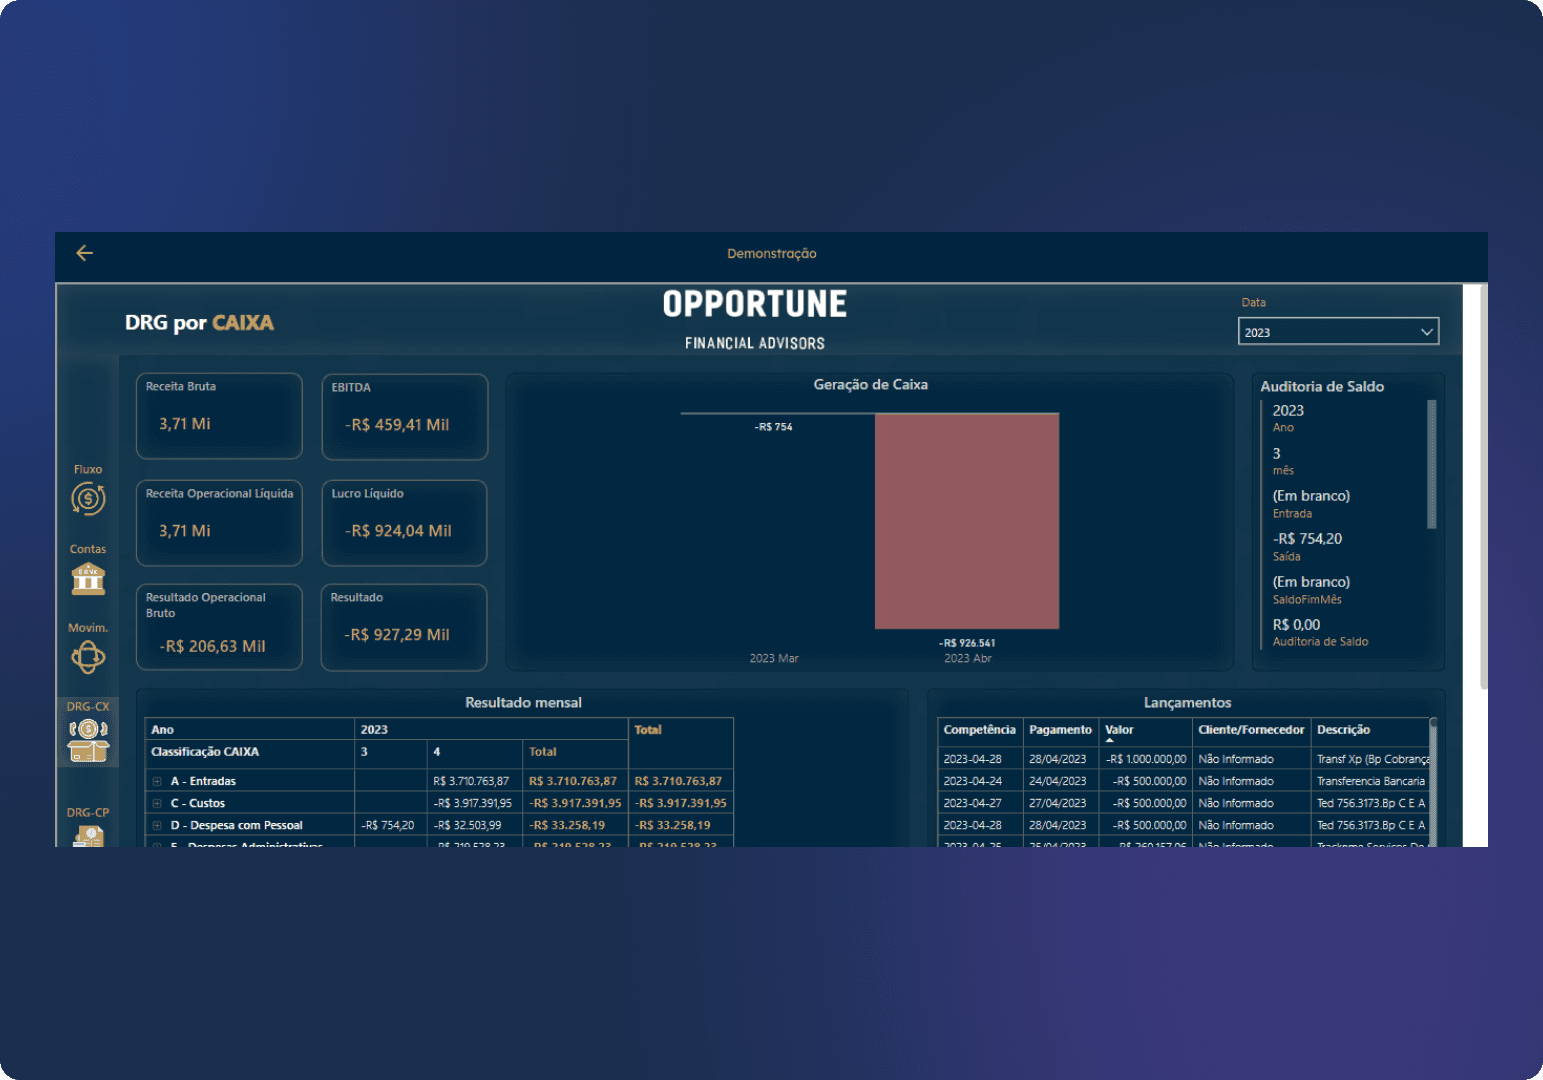
Previous screen
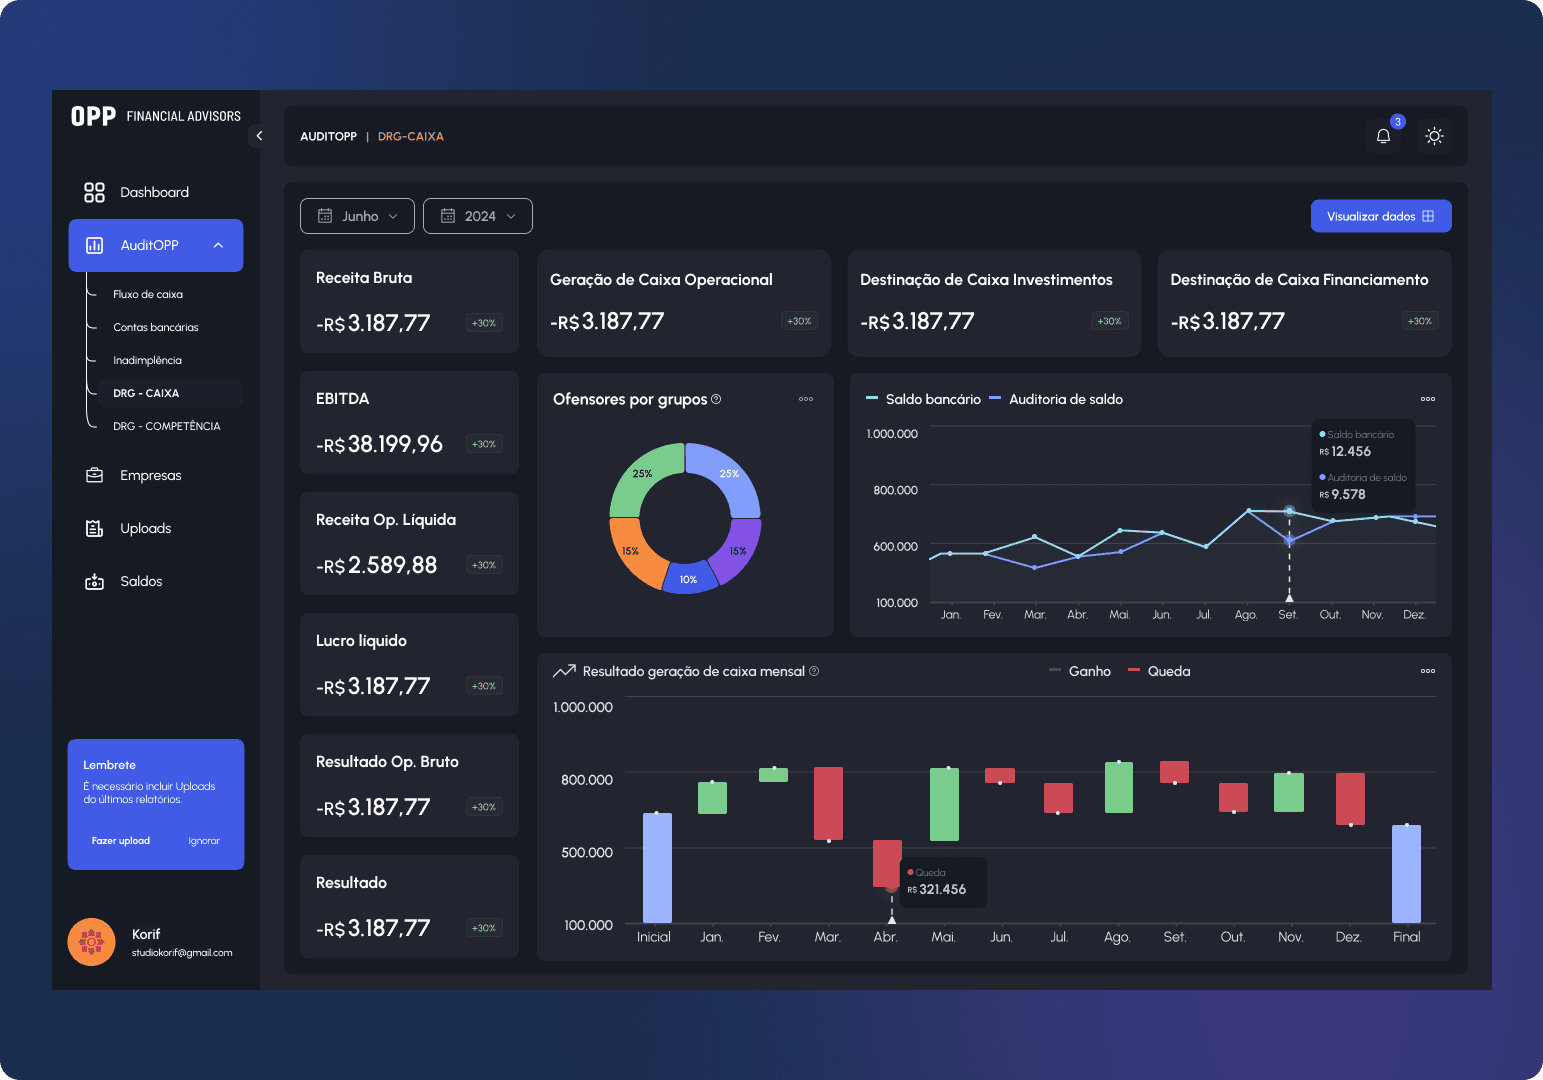
Redesigned screen
Monthly DRG — Cash table
Components are the foundation of the system. Without them, the application cannot scale effectively, files become harder to organize, and communication between designers becomes less consistent.
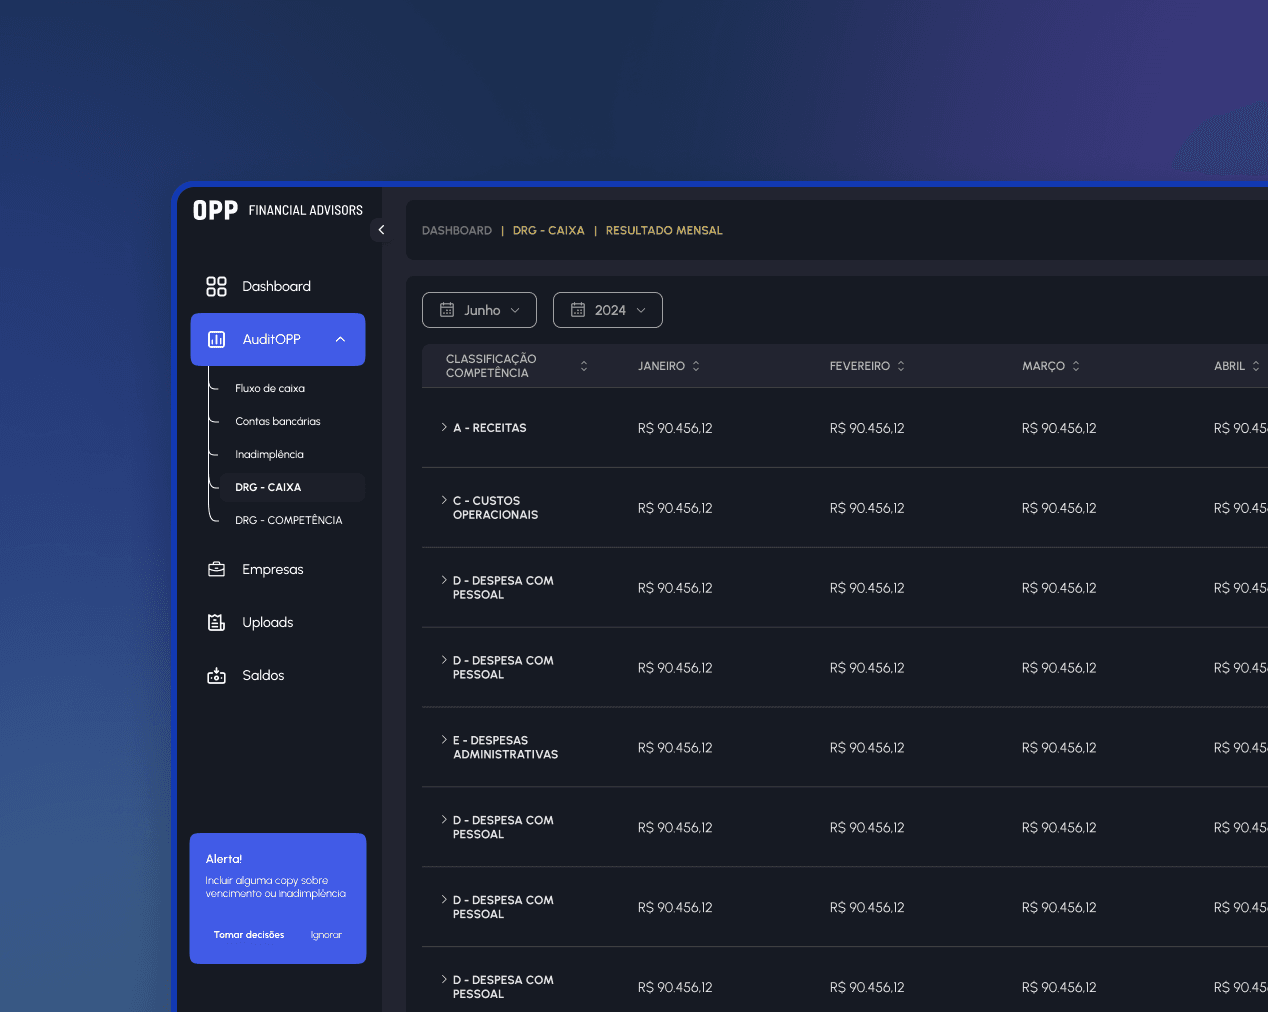
Tables
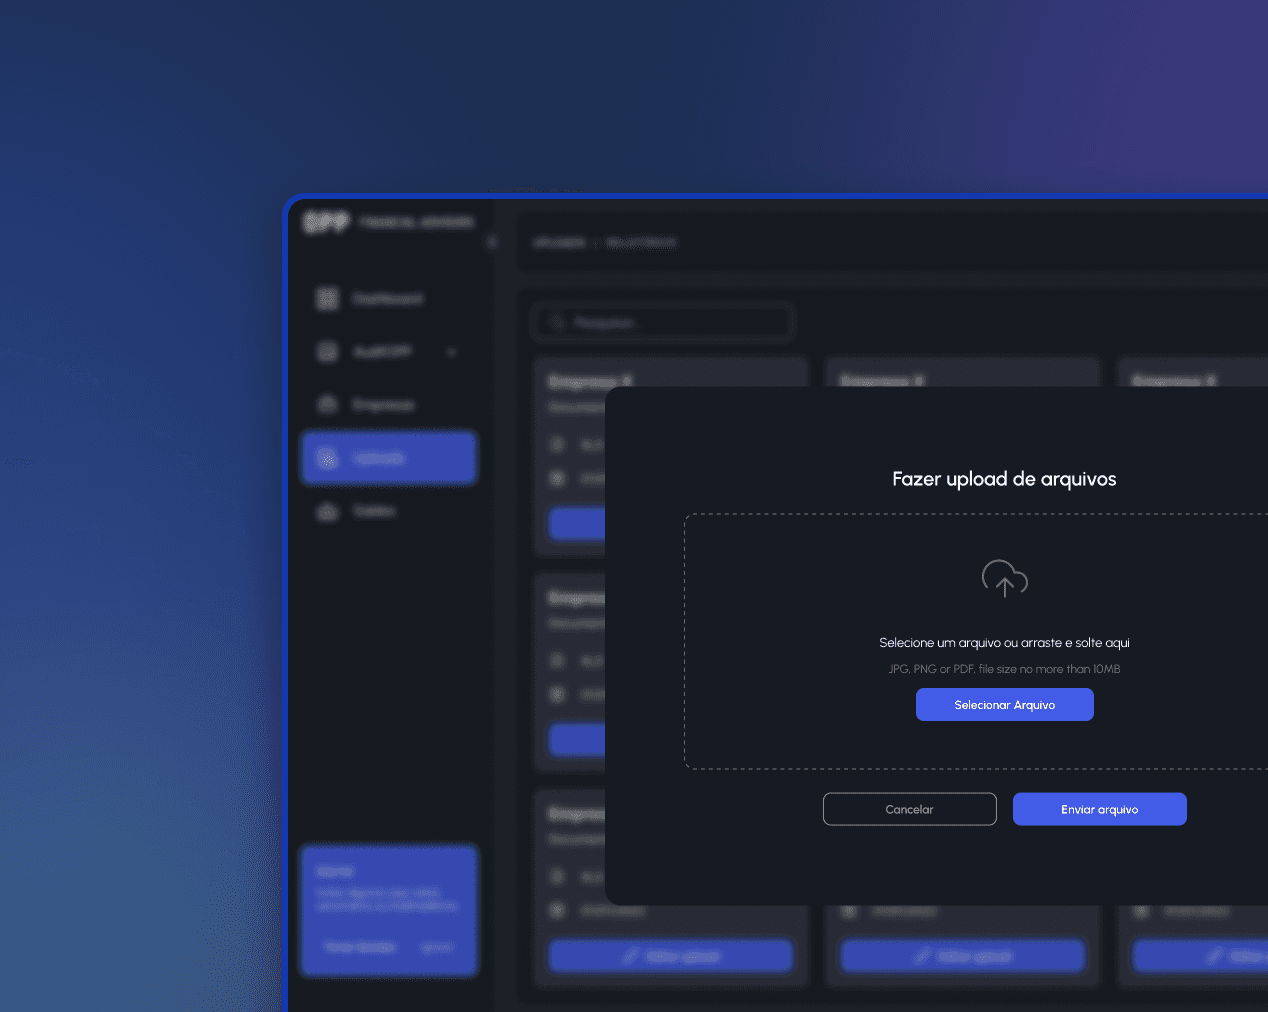
Upload and editing modals
Charts
The Style Guide defines the system’s visual foundation. Without it, we would not be able to apply consistent standards or scale the project.
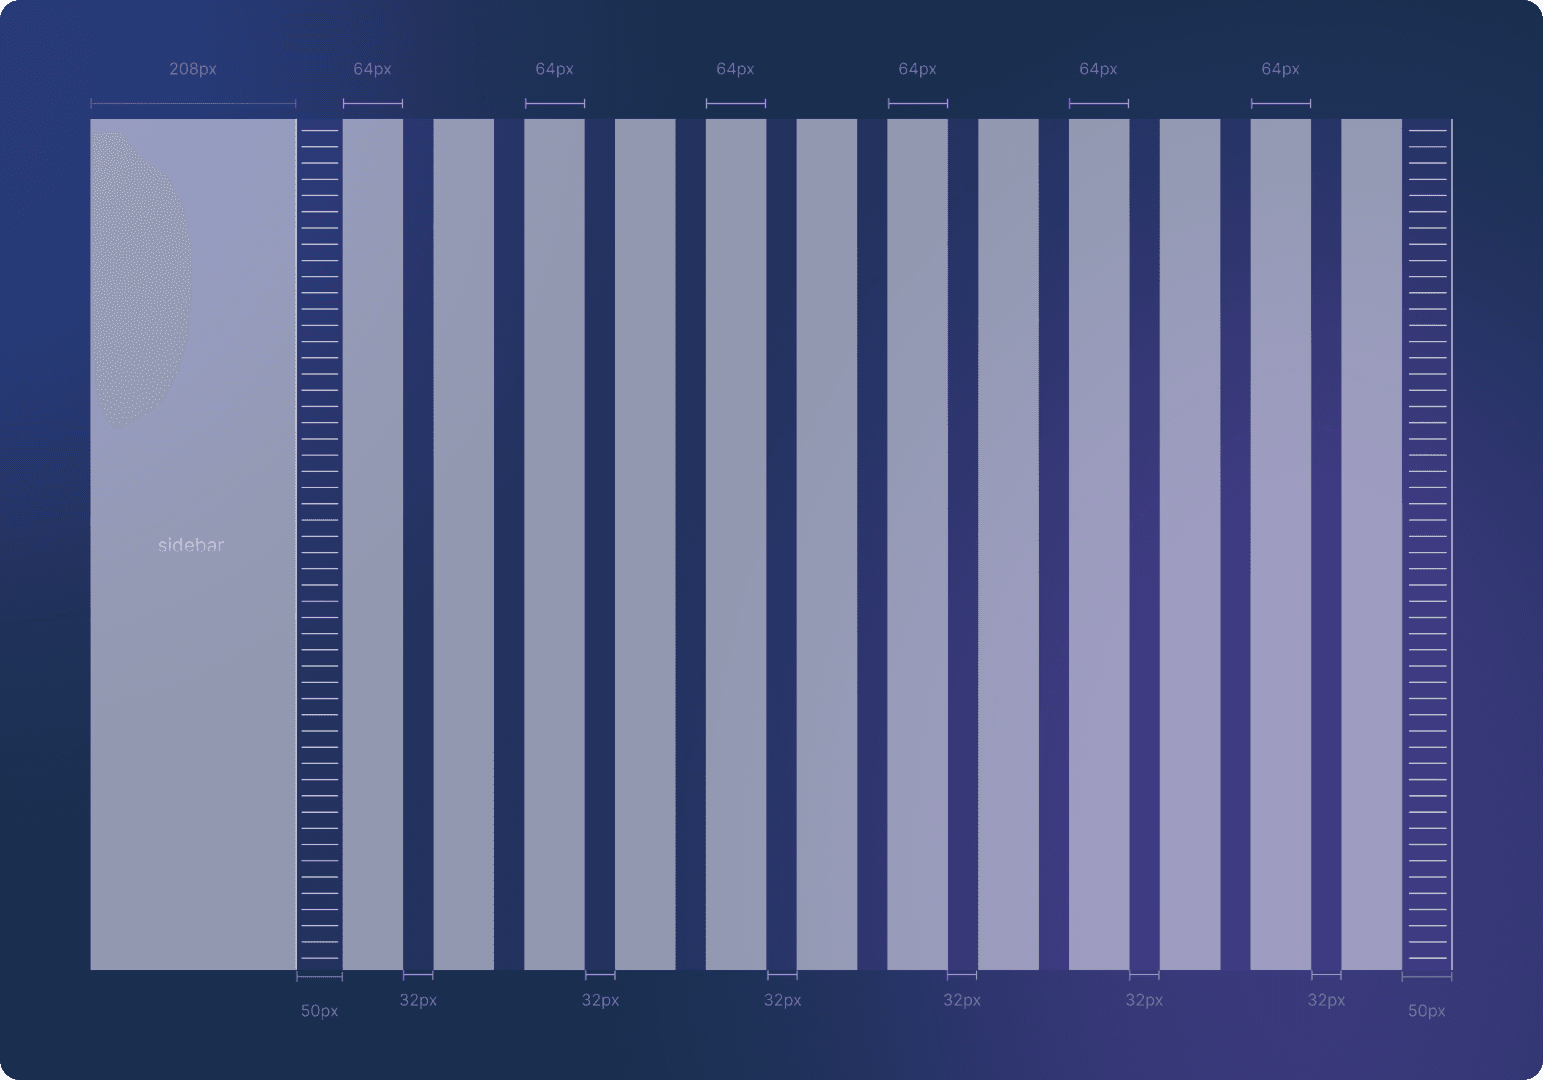
Grids
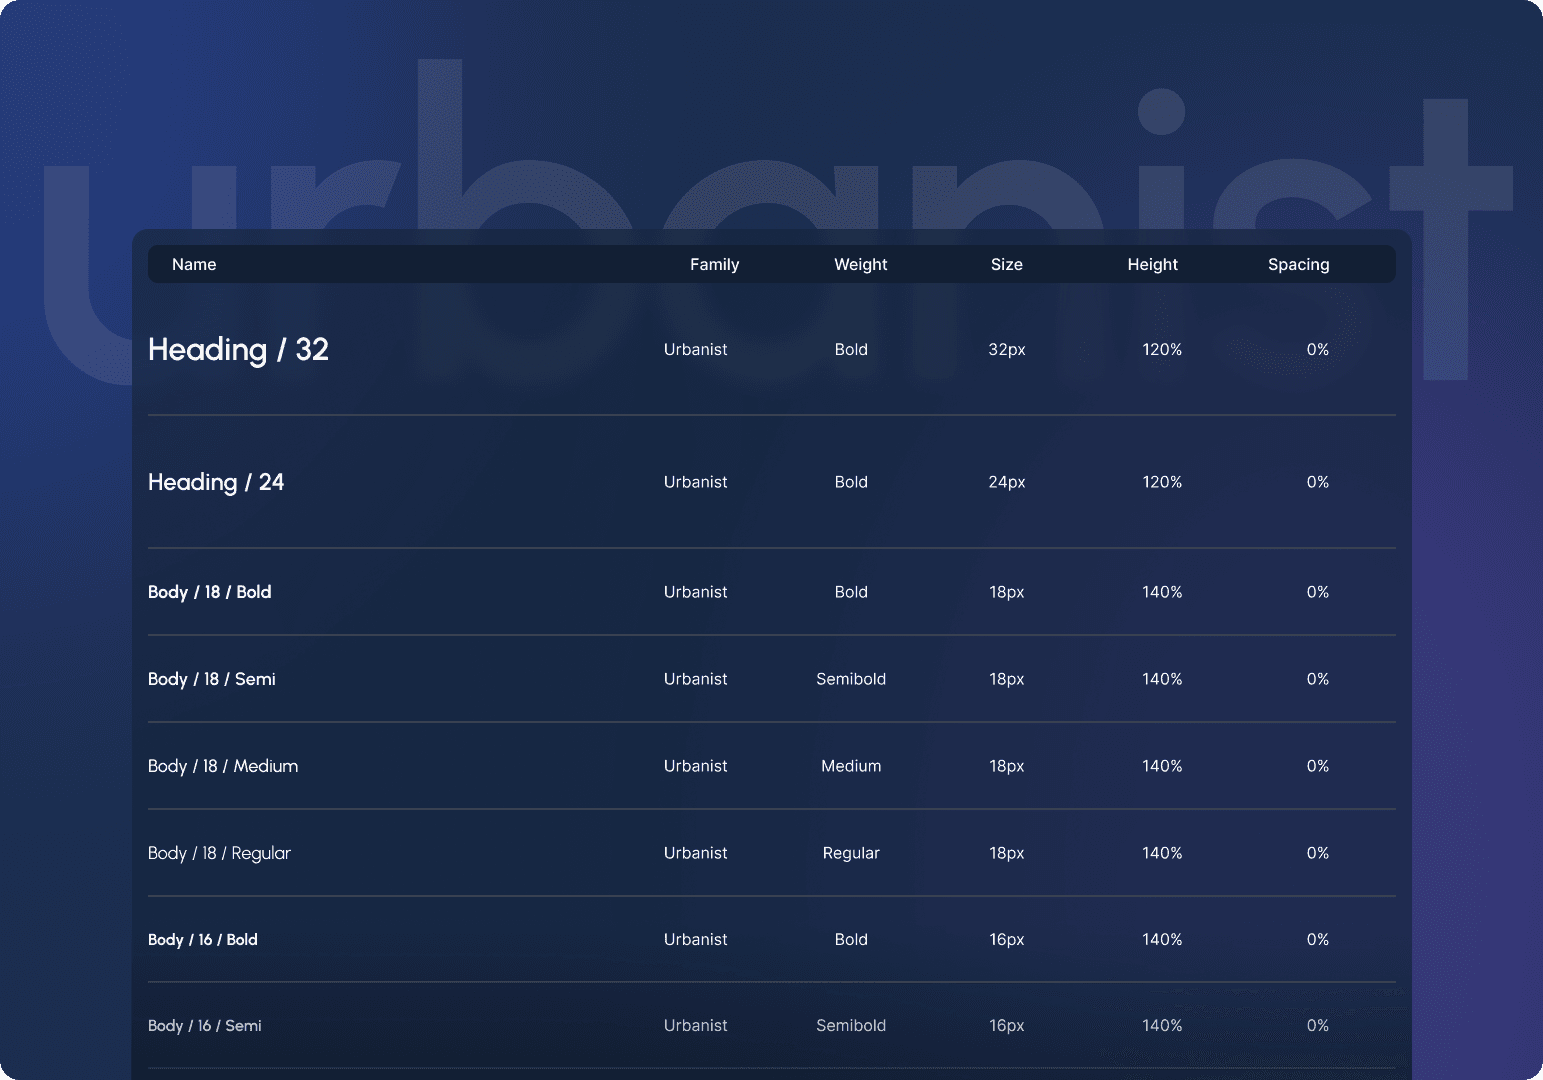
Typography
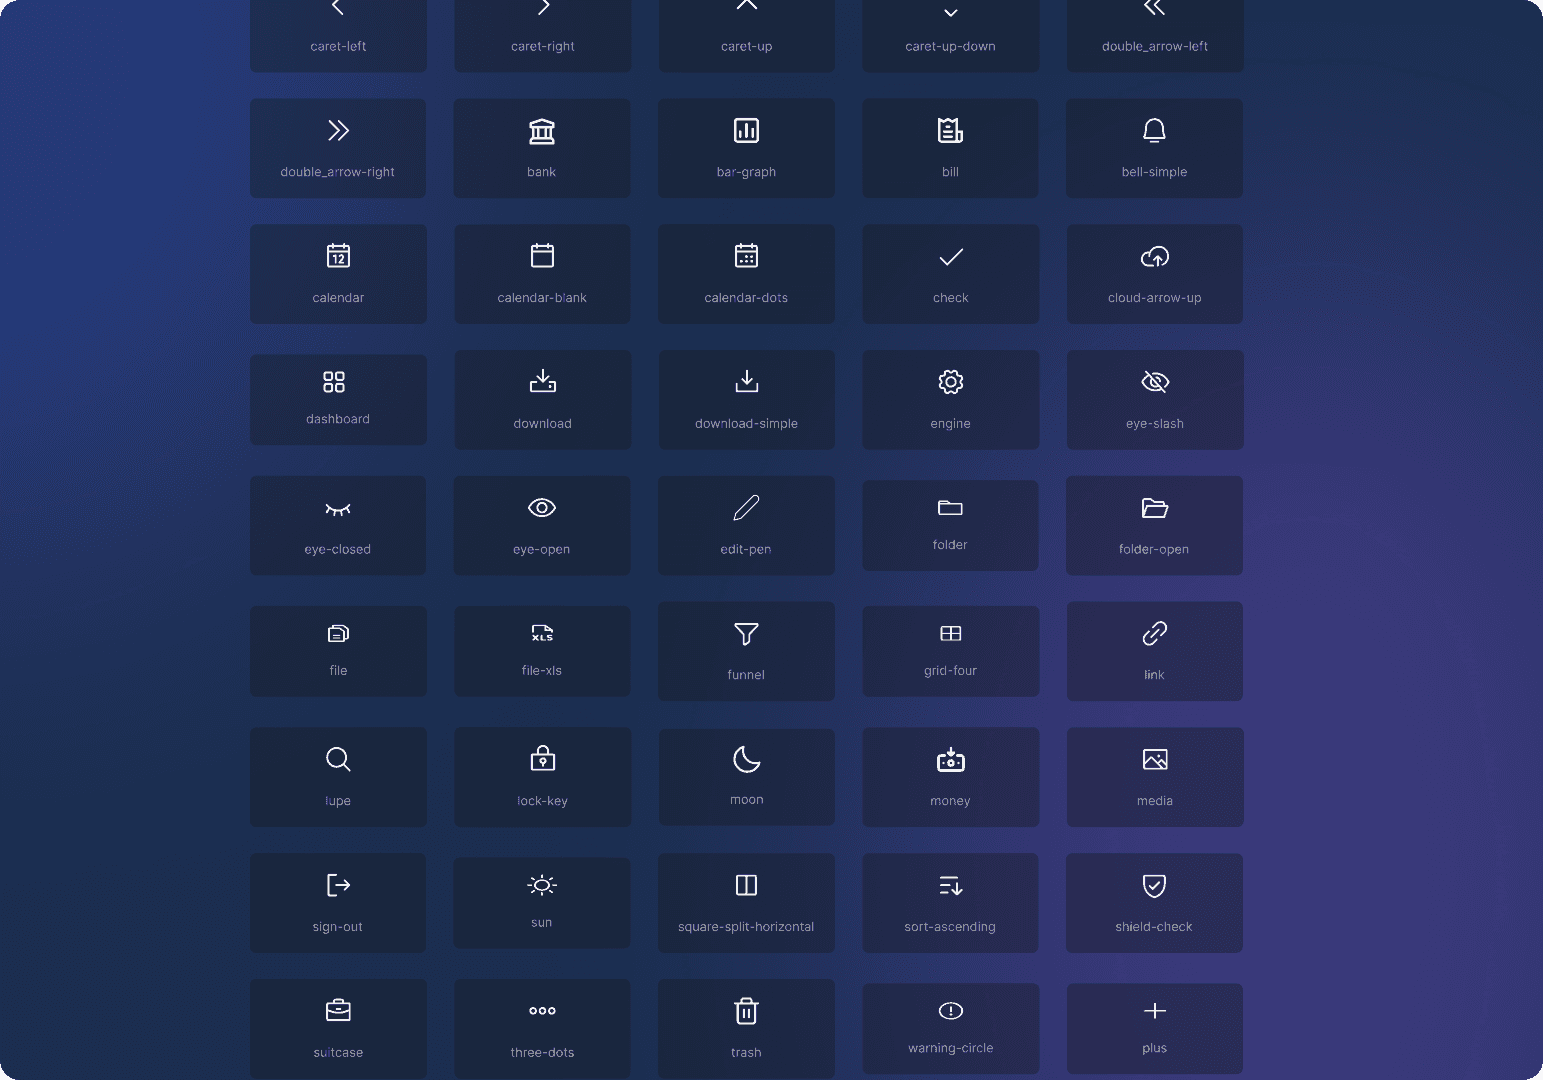
Iconography

Color palette
We introduced Dark and Light modes to improve accessibility and provide a more comfortable viewing experience.
New sitemap
As part of the redesign, I reorganized the system navigation and reduced the number of screens by around 40%.
Some steps were moved into modals, removing unnecessary screens and making the experience faster and more direct. This simplified navigation, reduced product complexity, and helped users stay focused on their main tasks.

Key changes
Fewer screens
Approximately 40% fewer screens in the flow.
Simpler flows
More direct paths to access information and complete actions.
Use of modals
Secondary actions can now be completed without taking users away from the main screen.
Clearer navigation
A reorganized structure makes the system easier to understand.
Key takeaways
Team organization
Planning as a team is essential. It ensures everyone understands their role and prevents overlapping responsibilities.
Workshops
Meetings between the team and stakeholders were essential to understanding the product’s real problems and turning user pain points into solutions.
Token organization
For a project like this, organizing components and tokens creates a solid foundation, supporting scalability and better collaboration across the team.

© Andressa Mendes 2026. All Rights Reserved