Testing an app’s purchase flow
Testing a ticketing app using metrics to evaluate usability and identify improvements.

After completing the structure, prototyping, and high-fidelity design, I conducted unmoderated usability tests to evaluate the app and identify opportunities for improvement.
The test included 15 participants between the ages of 15 and 24, all within the app’s target audience.
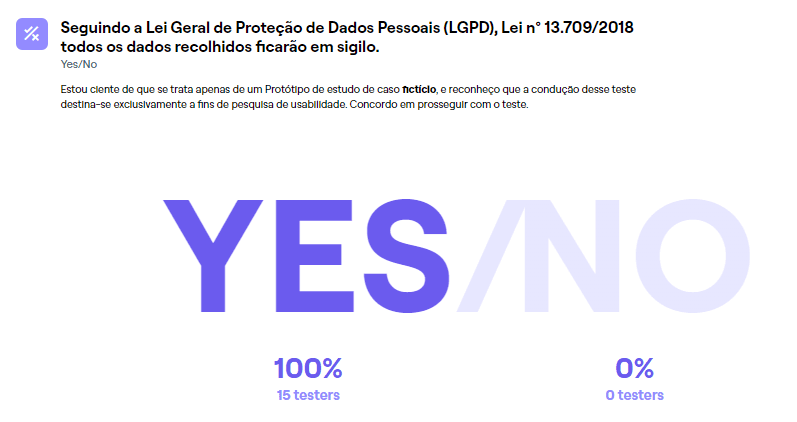
I started with a data protection notice explaining that the test was anonymous and that no real personal or credit card information would be collected.
I then asked an open-ended question about other platforms participants had used and any difficulties they experienced while using them.
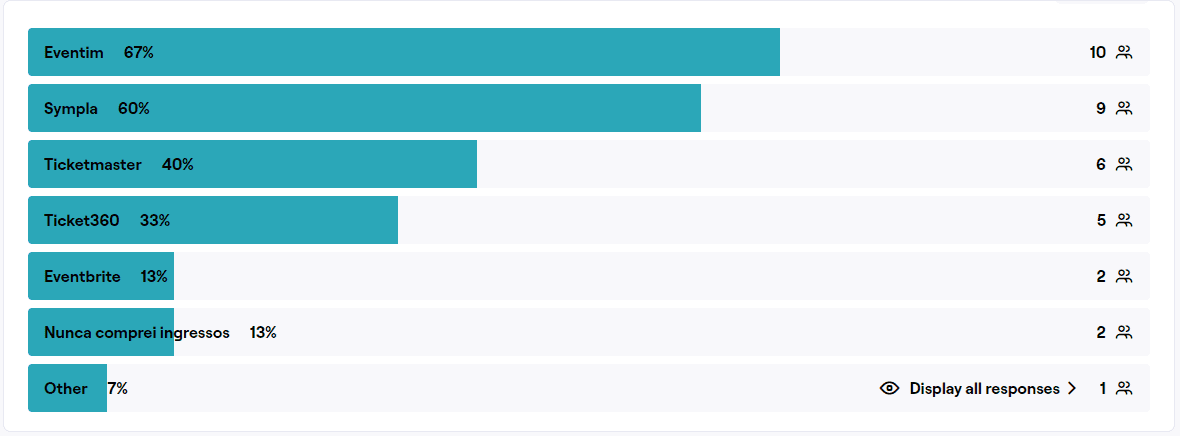
Have you ever used a website or app to buy tickets for an event? If so, which one?
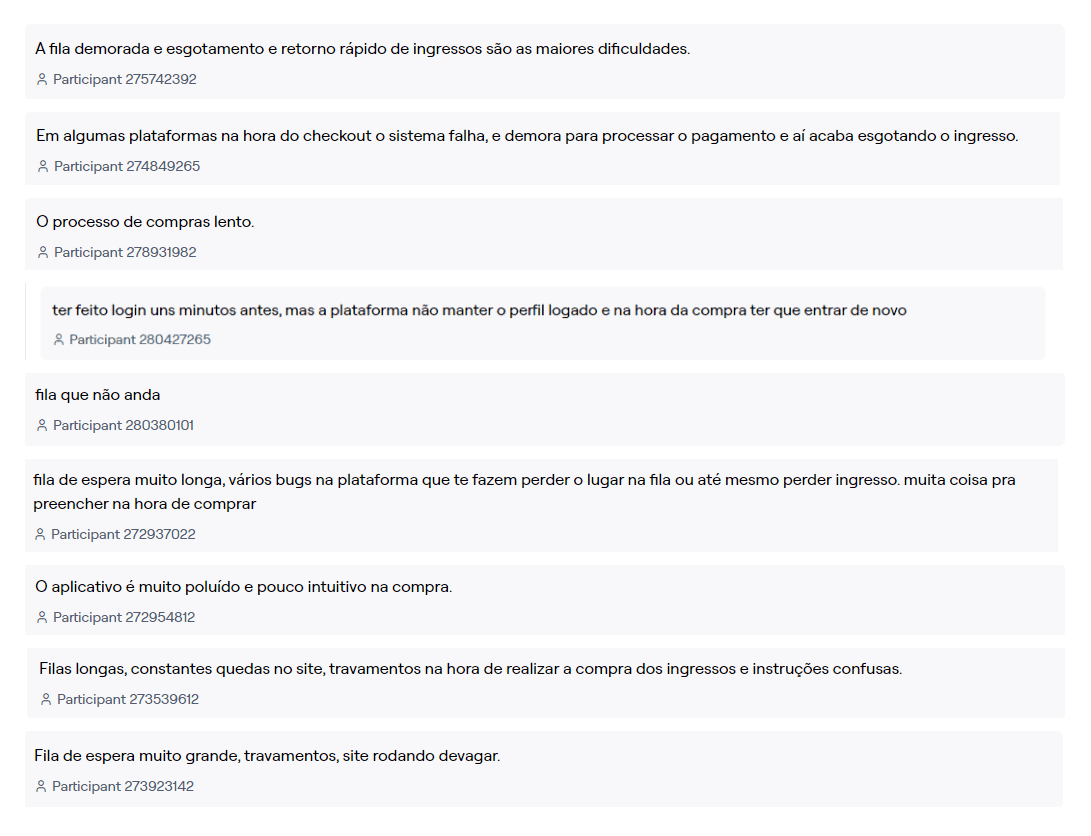
What difficulties have you experienced when buying tickets through the platforms you mentioned?
I used three key metrics to evaluate the app’s usability and identify improvements:
Task success rate
The number of users who successfully complete the purchase flow.
Drop-off rate
The number of users who leave the flow before completing it and the difficulties they experience.
Time on task
How long it takes a user to complete the purchase flow.
Heatmaps were another important source of data. They showed where users clicked most often and helped reveal whether buttons, forms, or important information were being overlooked.
I divided the test into three tasks, following the experience of someone using the app for the first time:
1
Onboarding
First-time users need to complete onboarding, create an account, and enable their device’s location to see nearby events. How easy or difficult is this process?
2
Purchase flow
The user needs to buy two tickets for an O Grilo concert: one full-price ticket in Zone A and one half-price ticket on the right side of Zone C. They must then pay with the default credit card in a single installment.
3
Findability
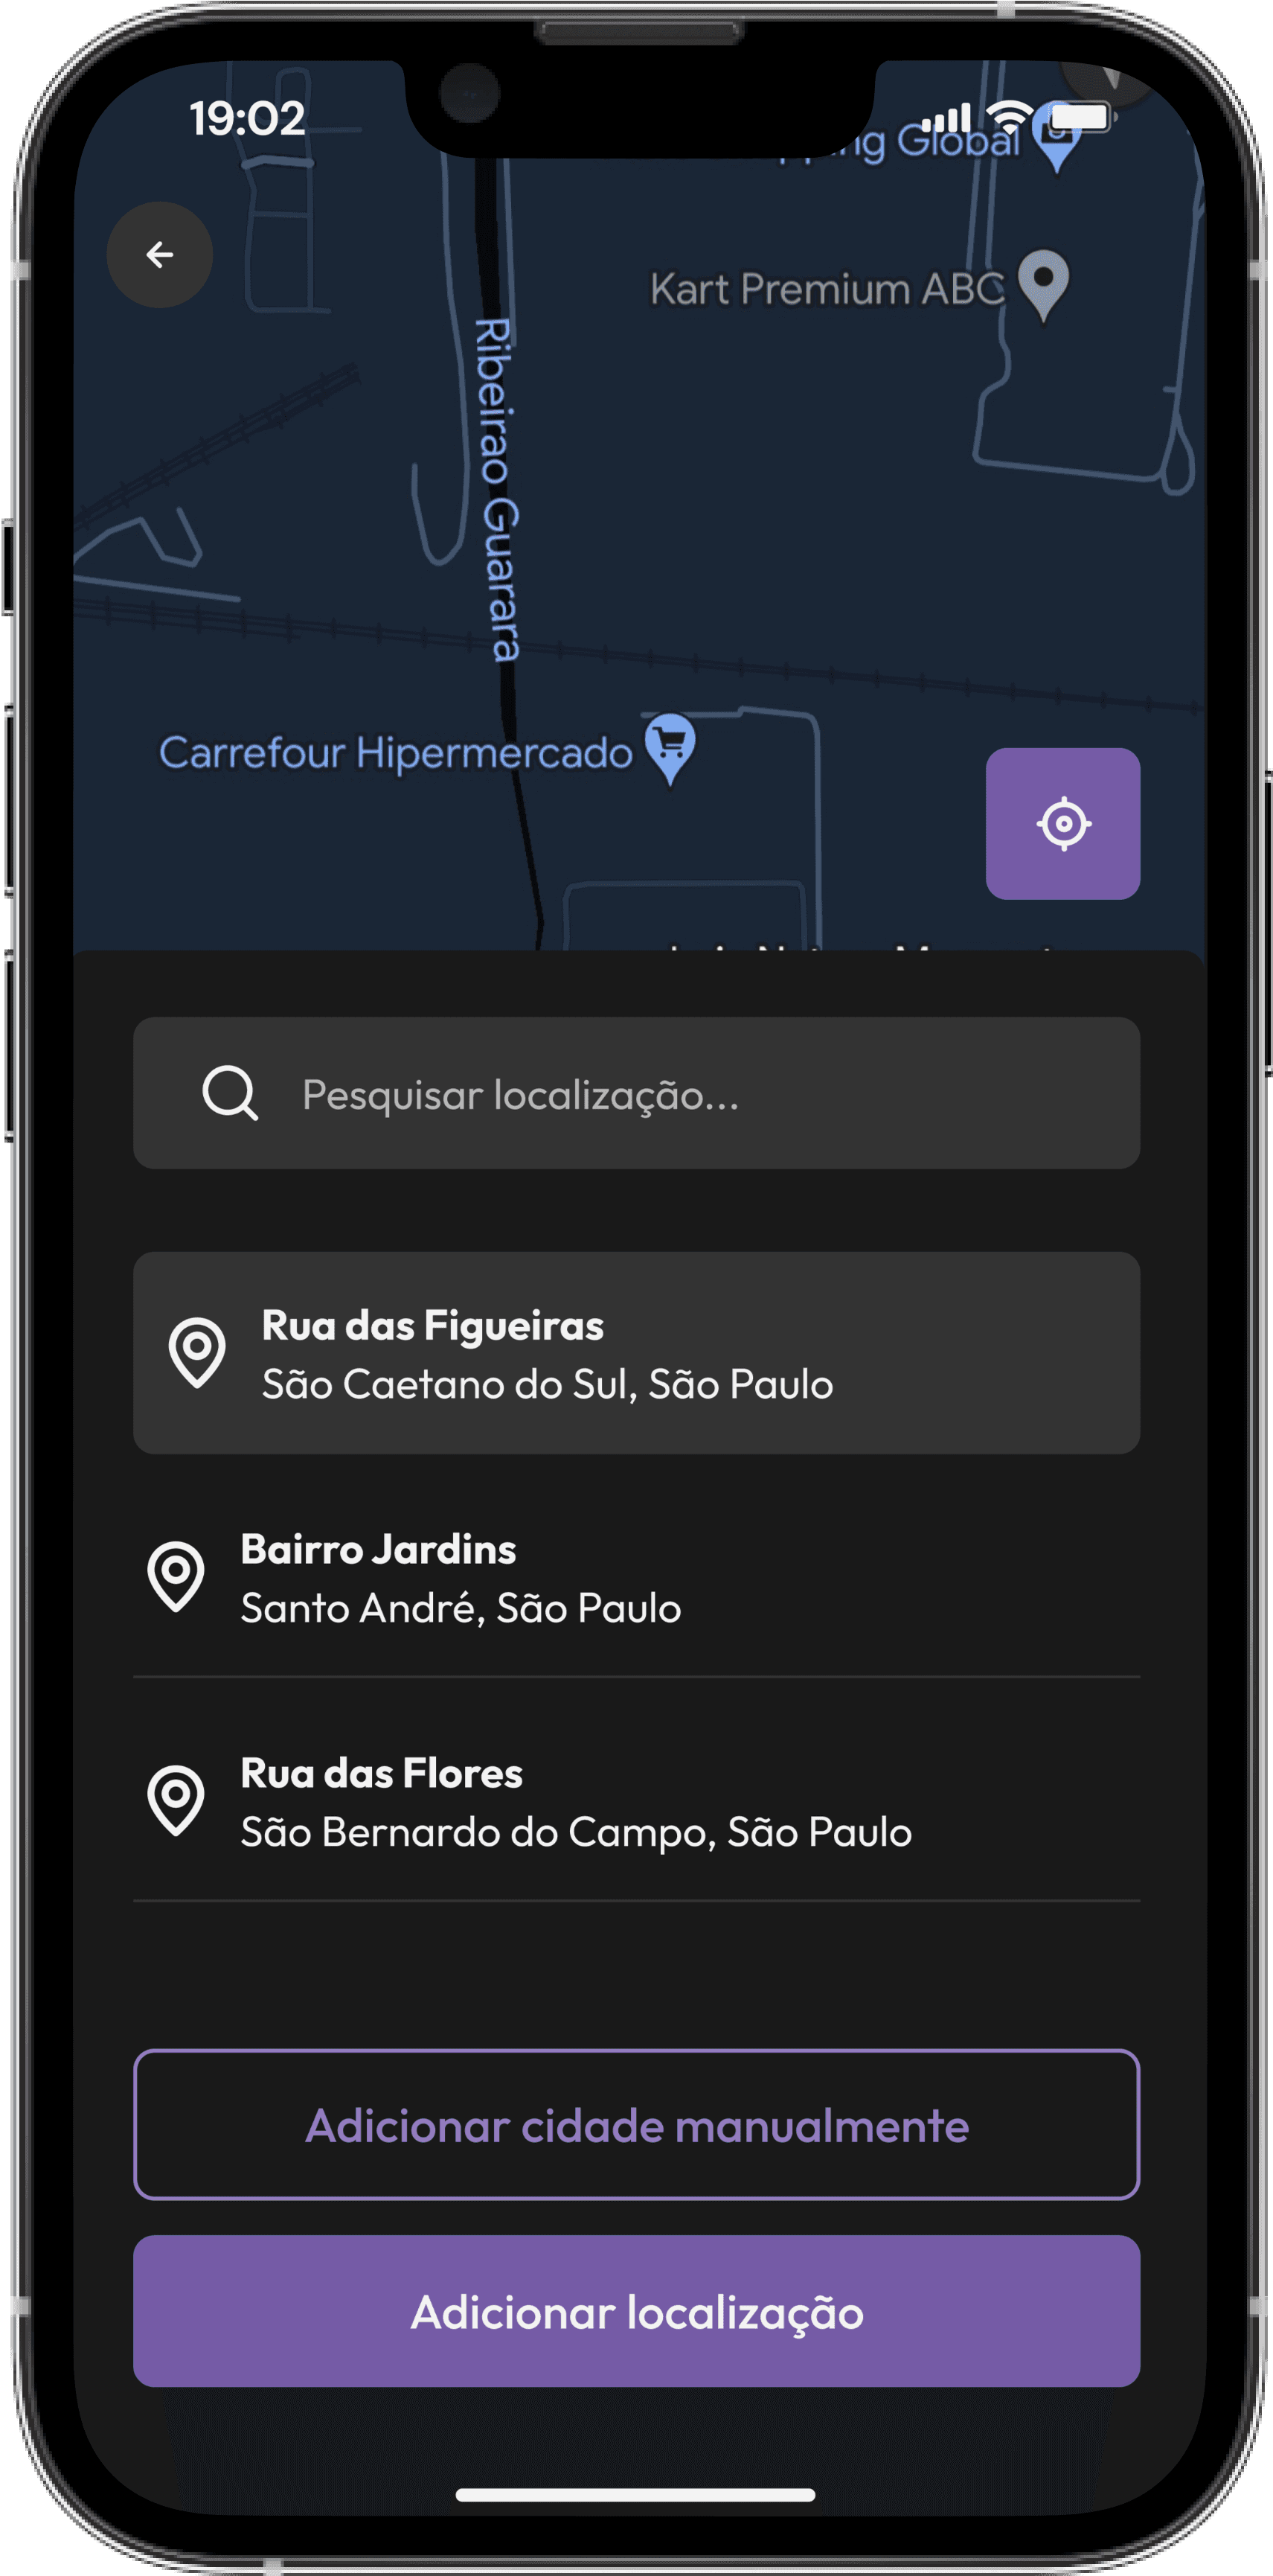
The user needs to find the location setting and change their current location to Rua das Flores.
How easy or difficult is it to find this option in the app?
Task 1 — Onboarding
The user goes through the first-time onboarding experience, creates an account, and enables their current location.
Task 1 heatmap
Key issues
The two screens with the highest misclick rates were:
Login screen: Some users interacted with the login fields even though the goal was to create a new account.
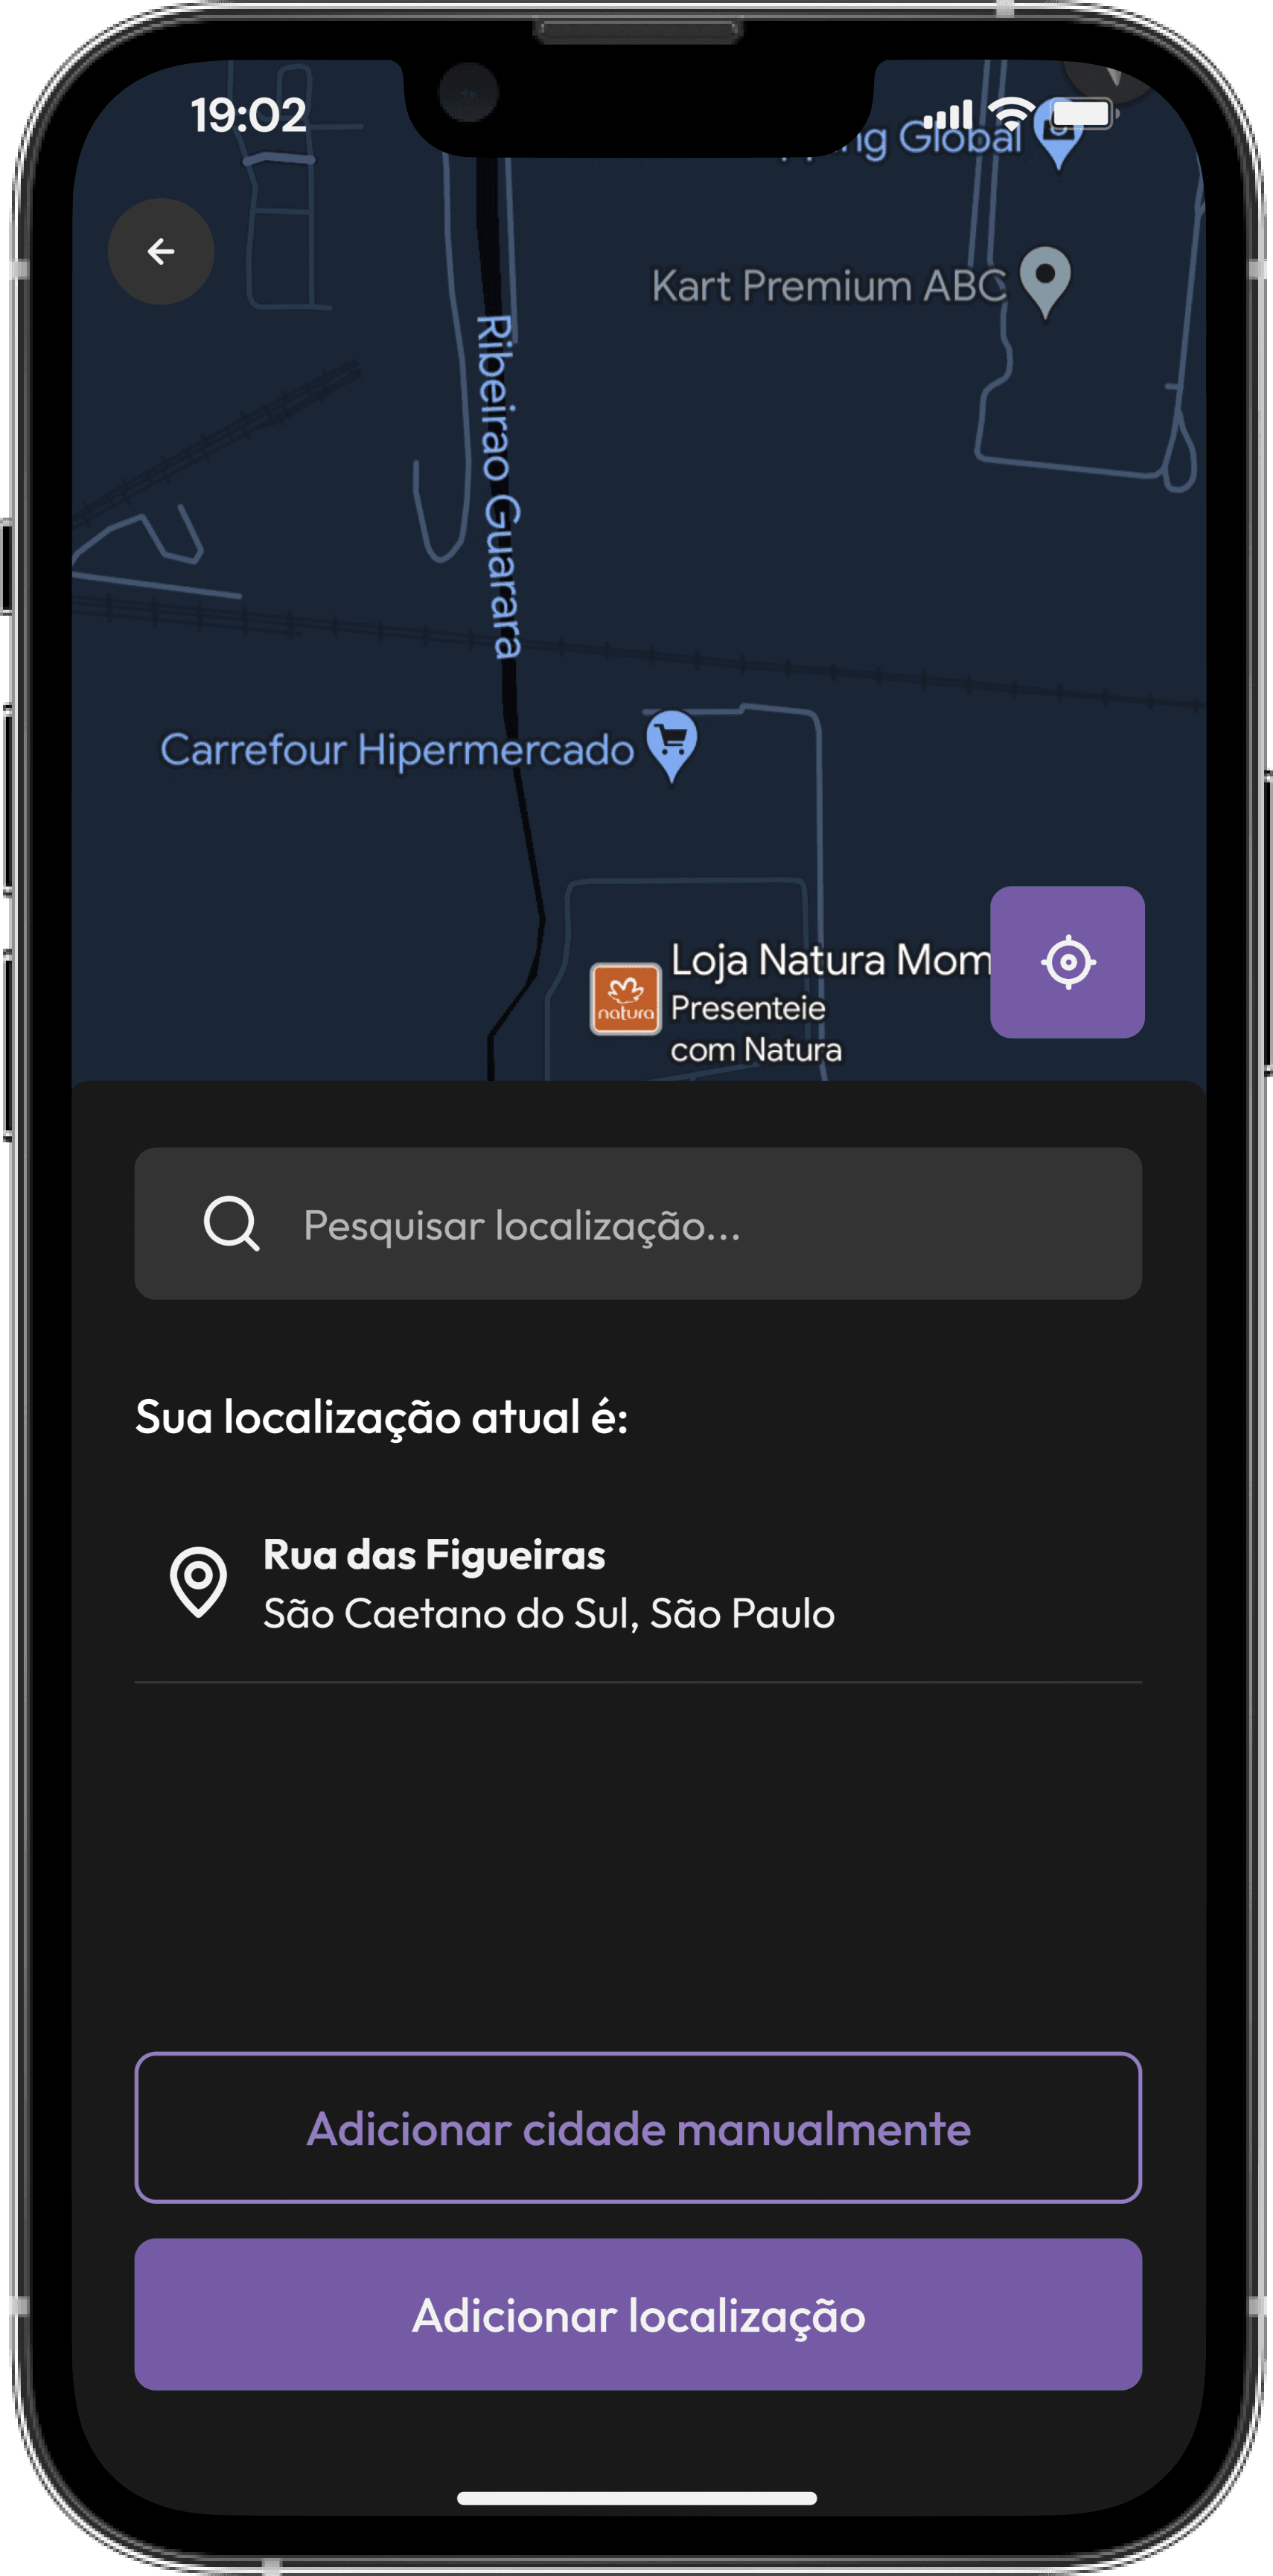
Screen shown after accepting location access: It looked the same as the previous screen, which confused users.
Improvements
Many ticketing apps allow users to explore the app as guests and create an account later if they choose to.
After location access is granted, the screen now displays the user’s current location, making it easier to confirm or edit it before continuing.
Previous screen
Updated screen
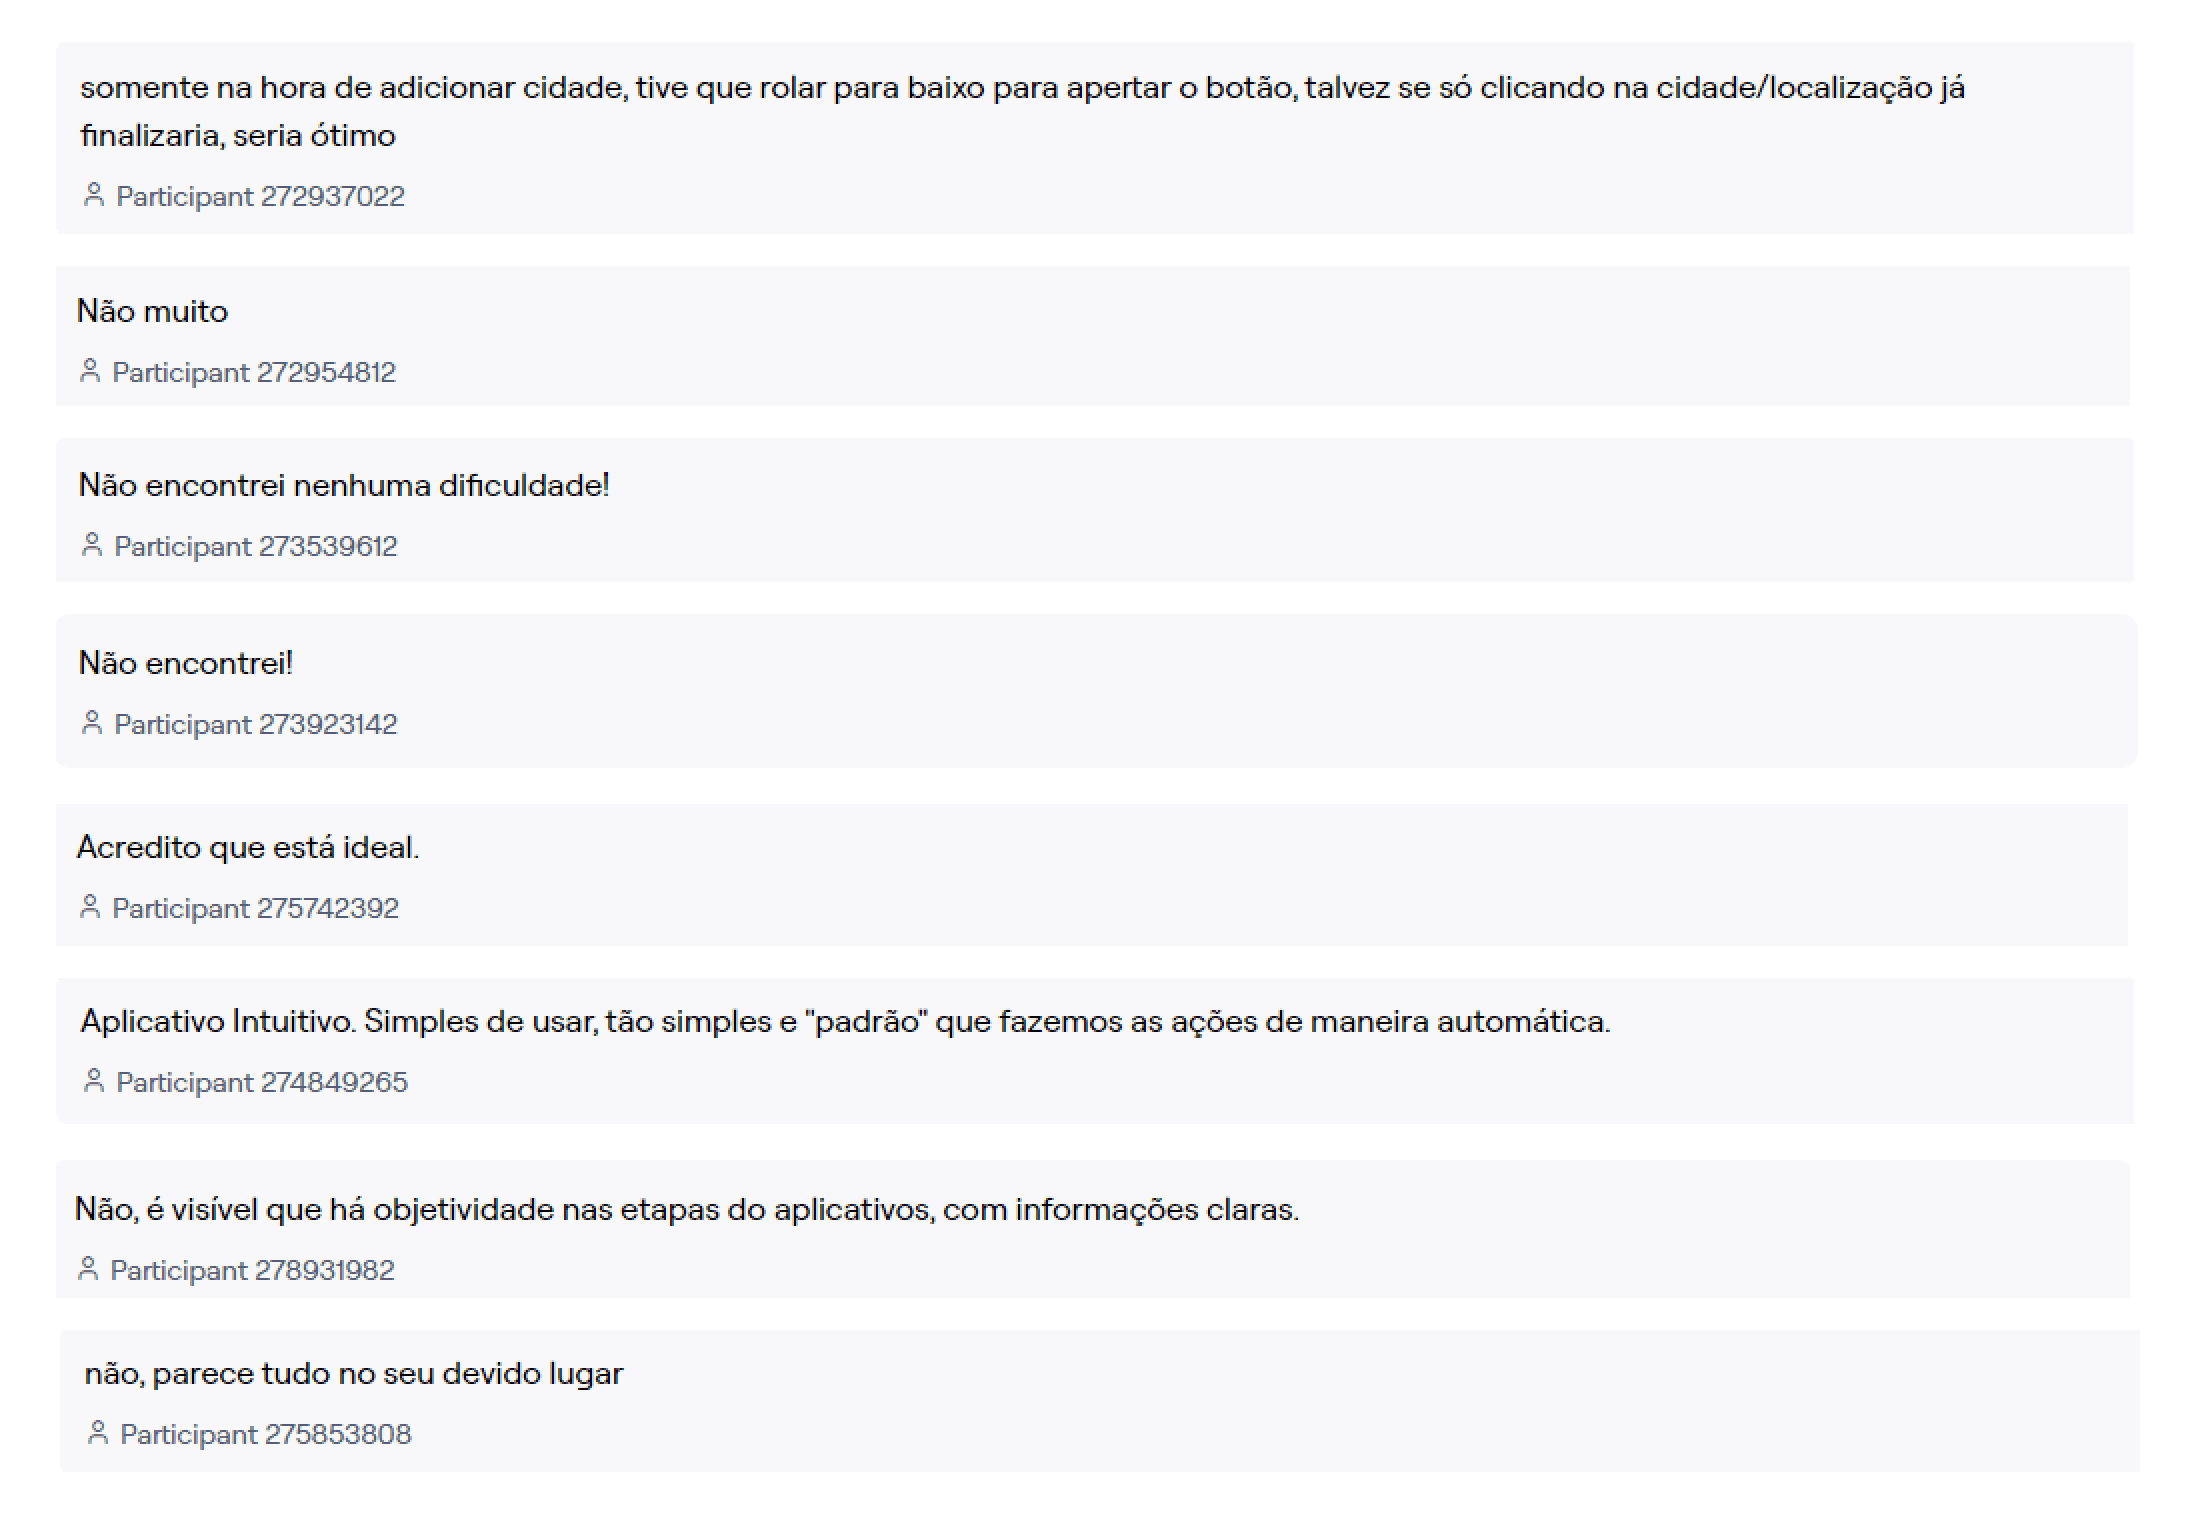
Based on user feedback and the difficulty rating for this task:
Did you experience any difficulty completing this task?
Task 2 — Purchase flow
The user needs to buy two tickets for an O Grilo concert: one full-price ticket in Zone A and one half-price ticket on the right side of Zone C. They must then pay with the default credit card in a single installment.
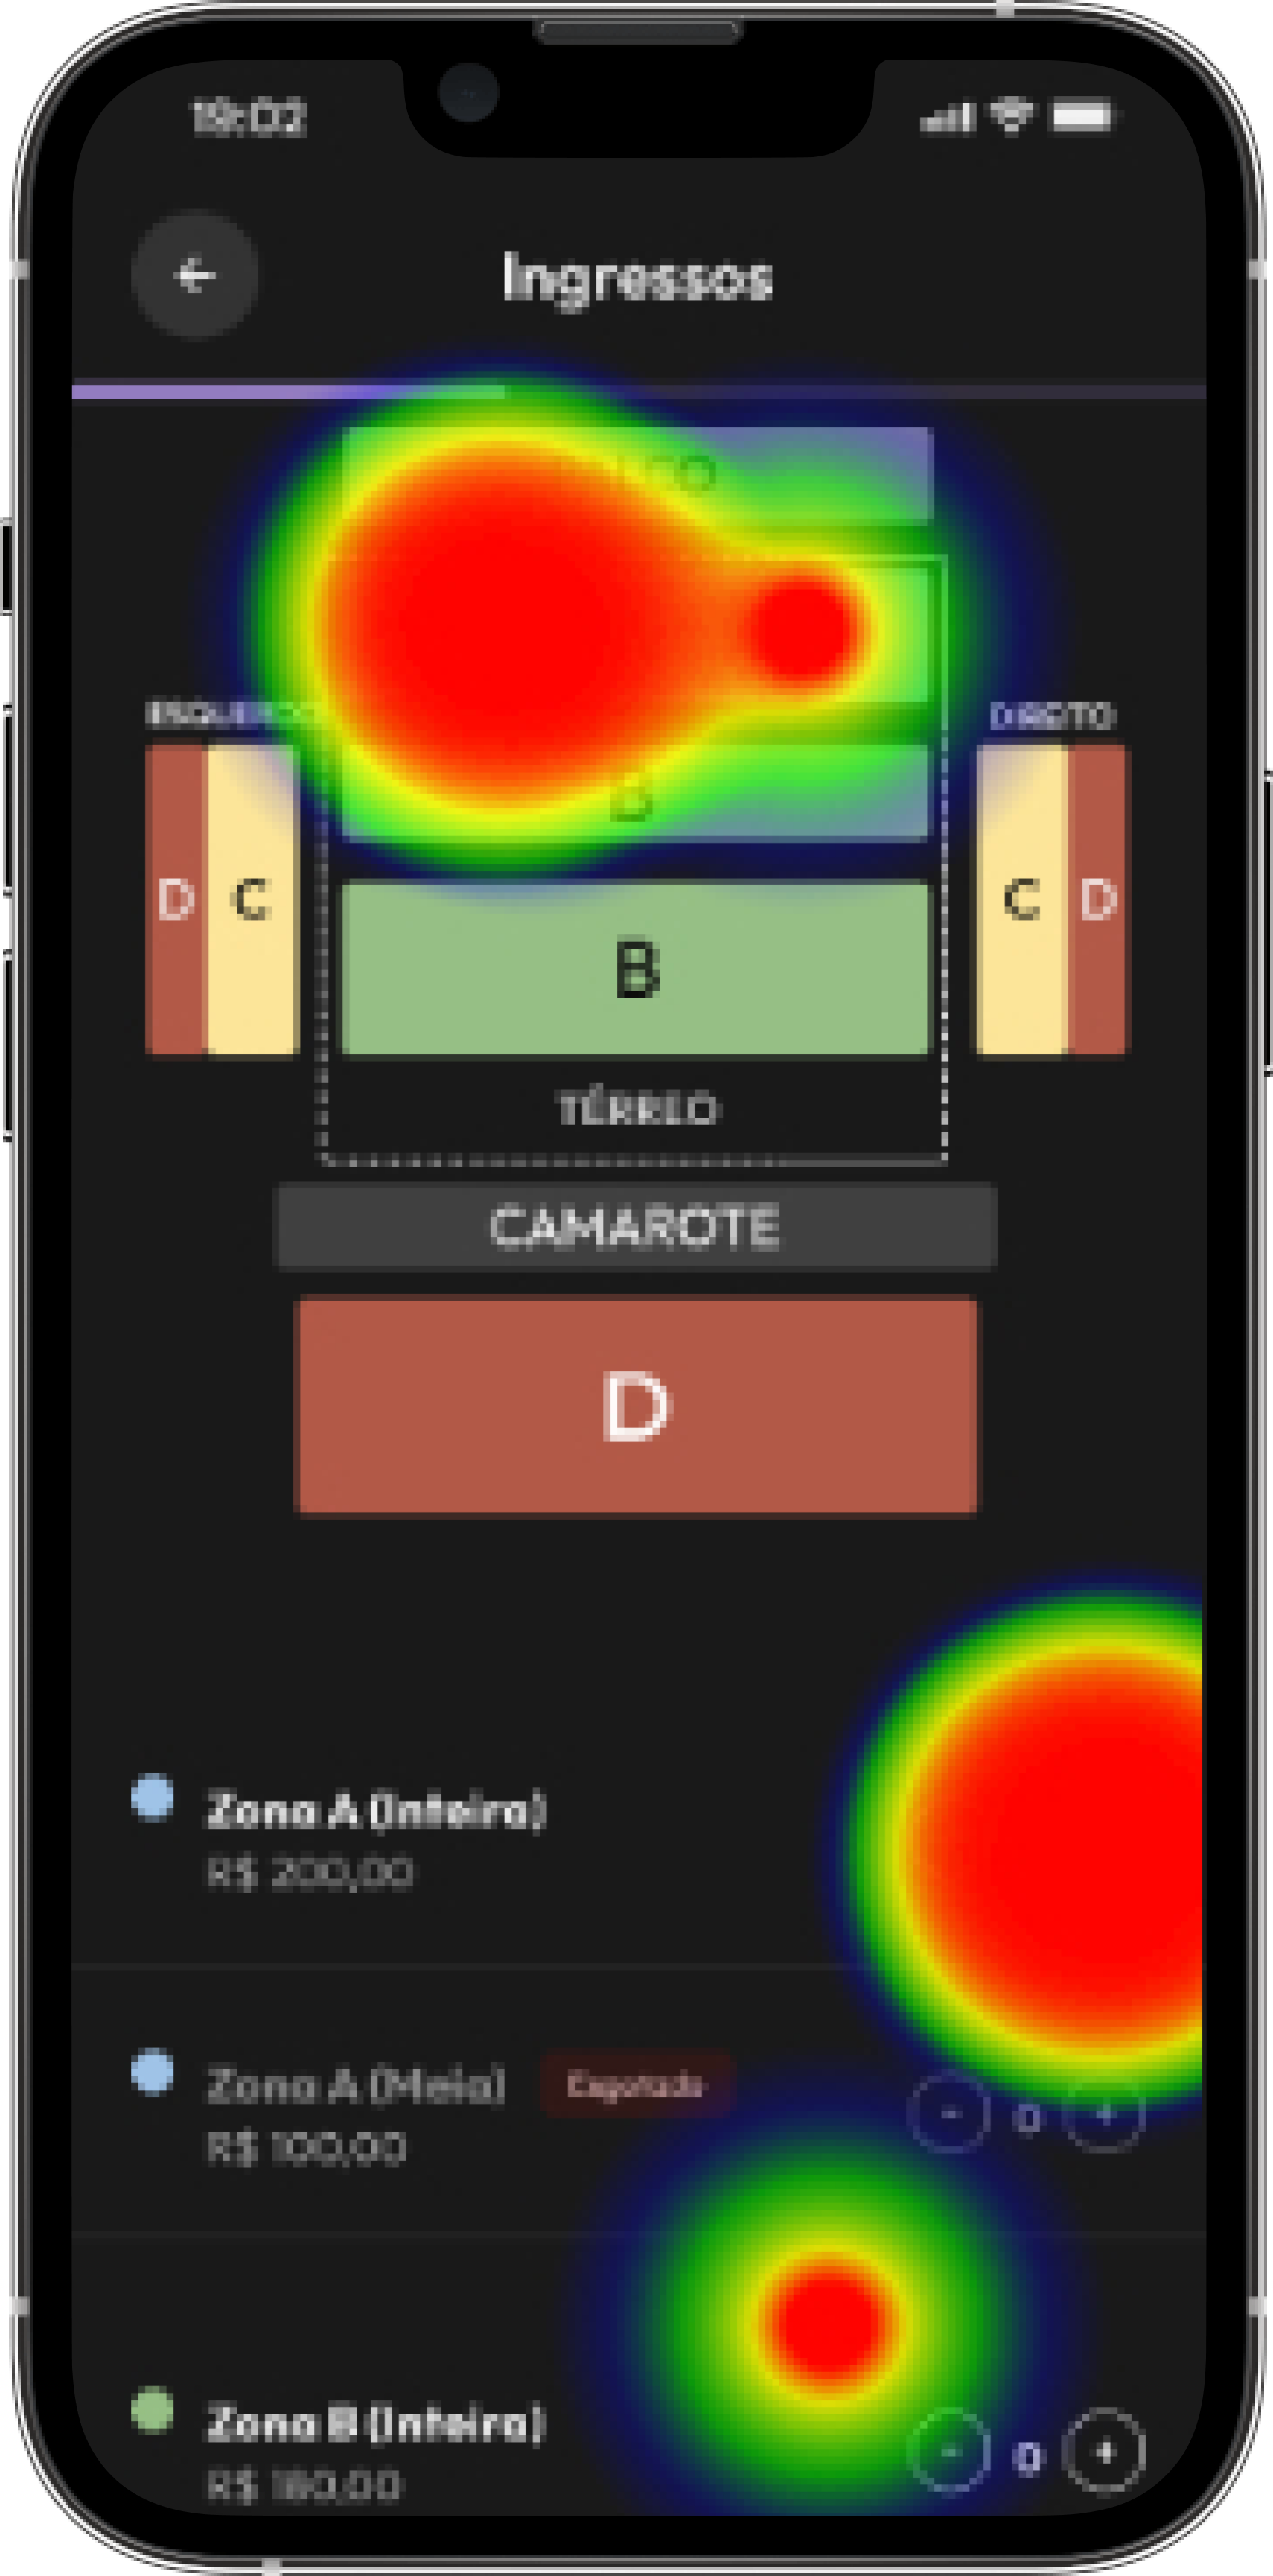
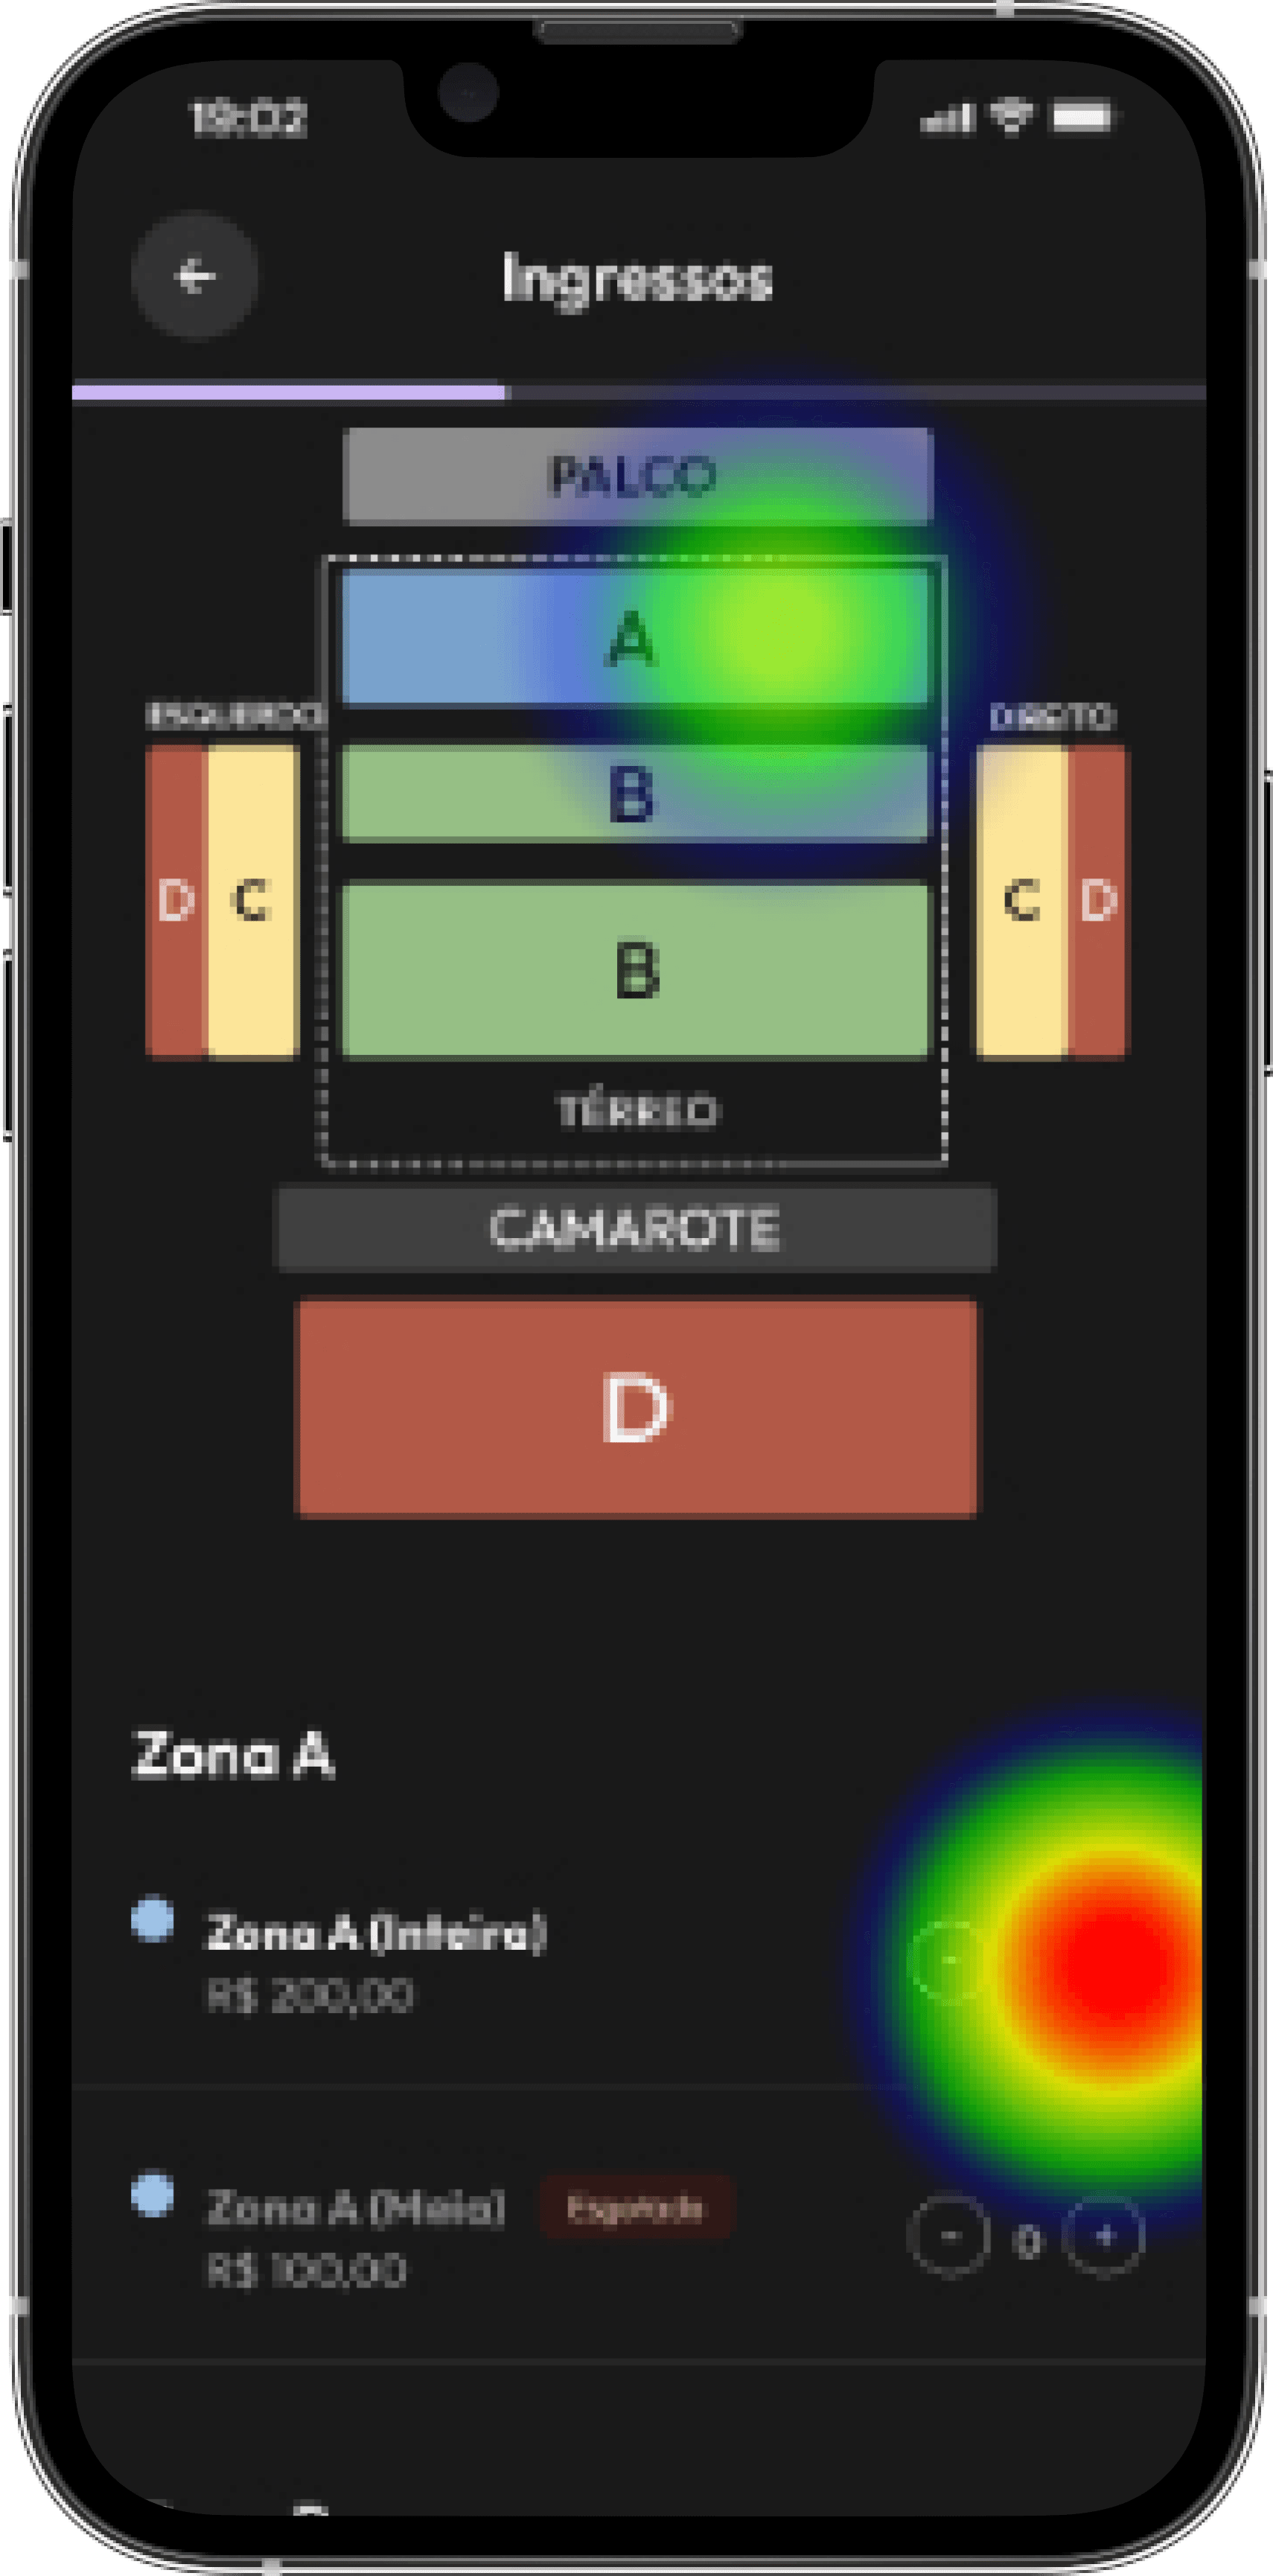
Task 2 heatmap
Key issues
The two screens with the highest misclick rates were:
Information form: The placeholder contrast made the fields look pre-filled. Some users clicked repeatedly while others skipped the fields because they thought the information had already been entered.
Ticket selection: Some users clicked the seating illustration expecting an interaction, but it was a dead area.
Improvements
The placeholder contrast was adjusted to prevent repeated unsuccessful clicks when filling out the form.
A scroll-to interaction was added to the seating image. When users select a section on the image, the page scrolls to the corresponding area where they can choose the number of tickets.
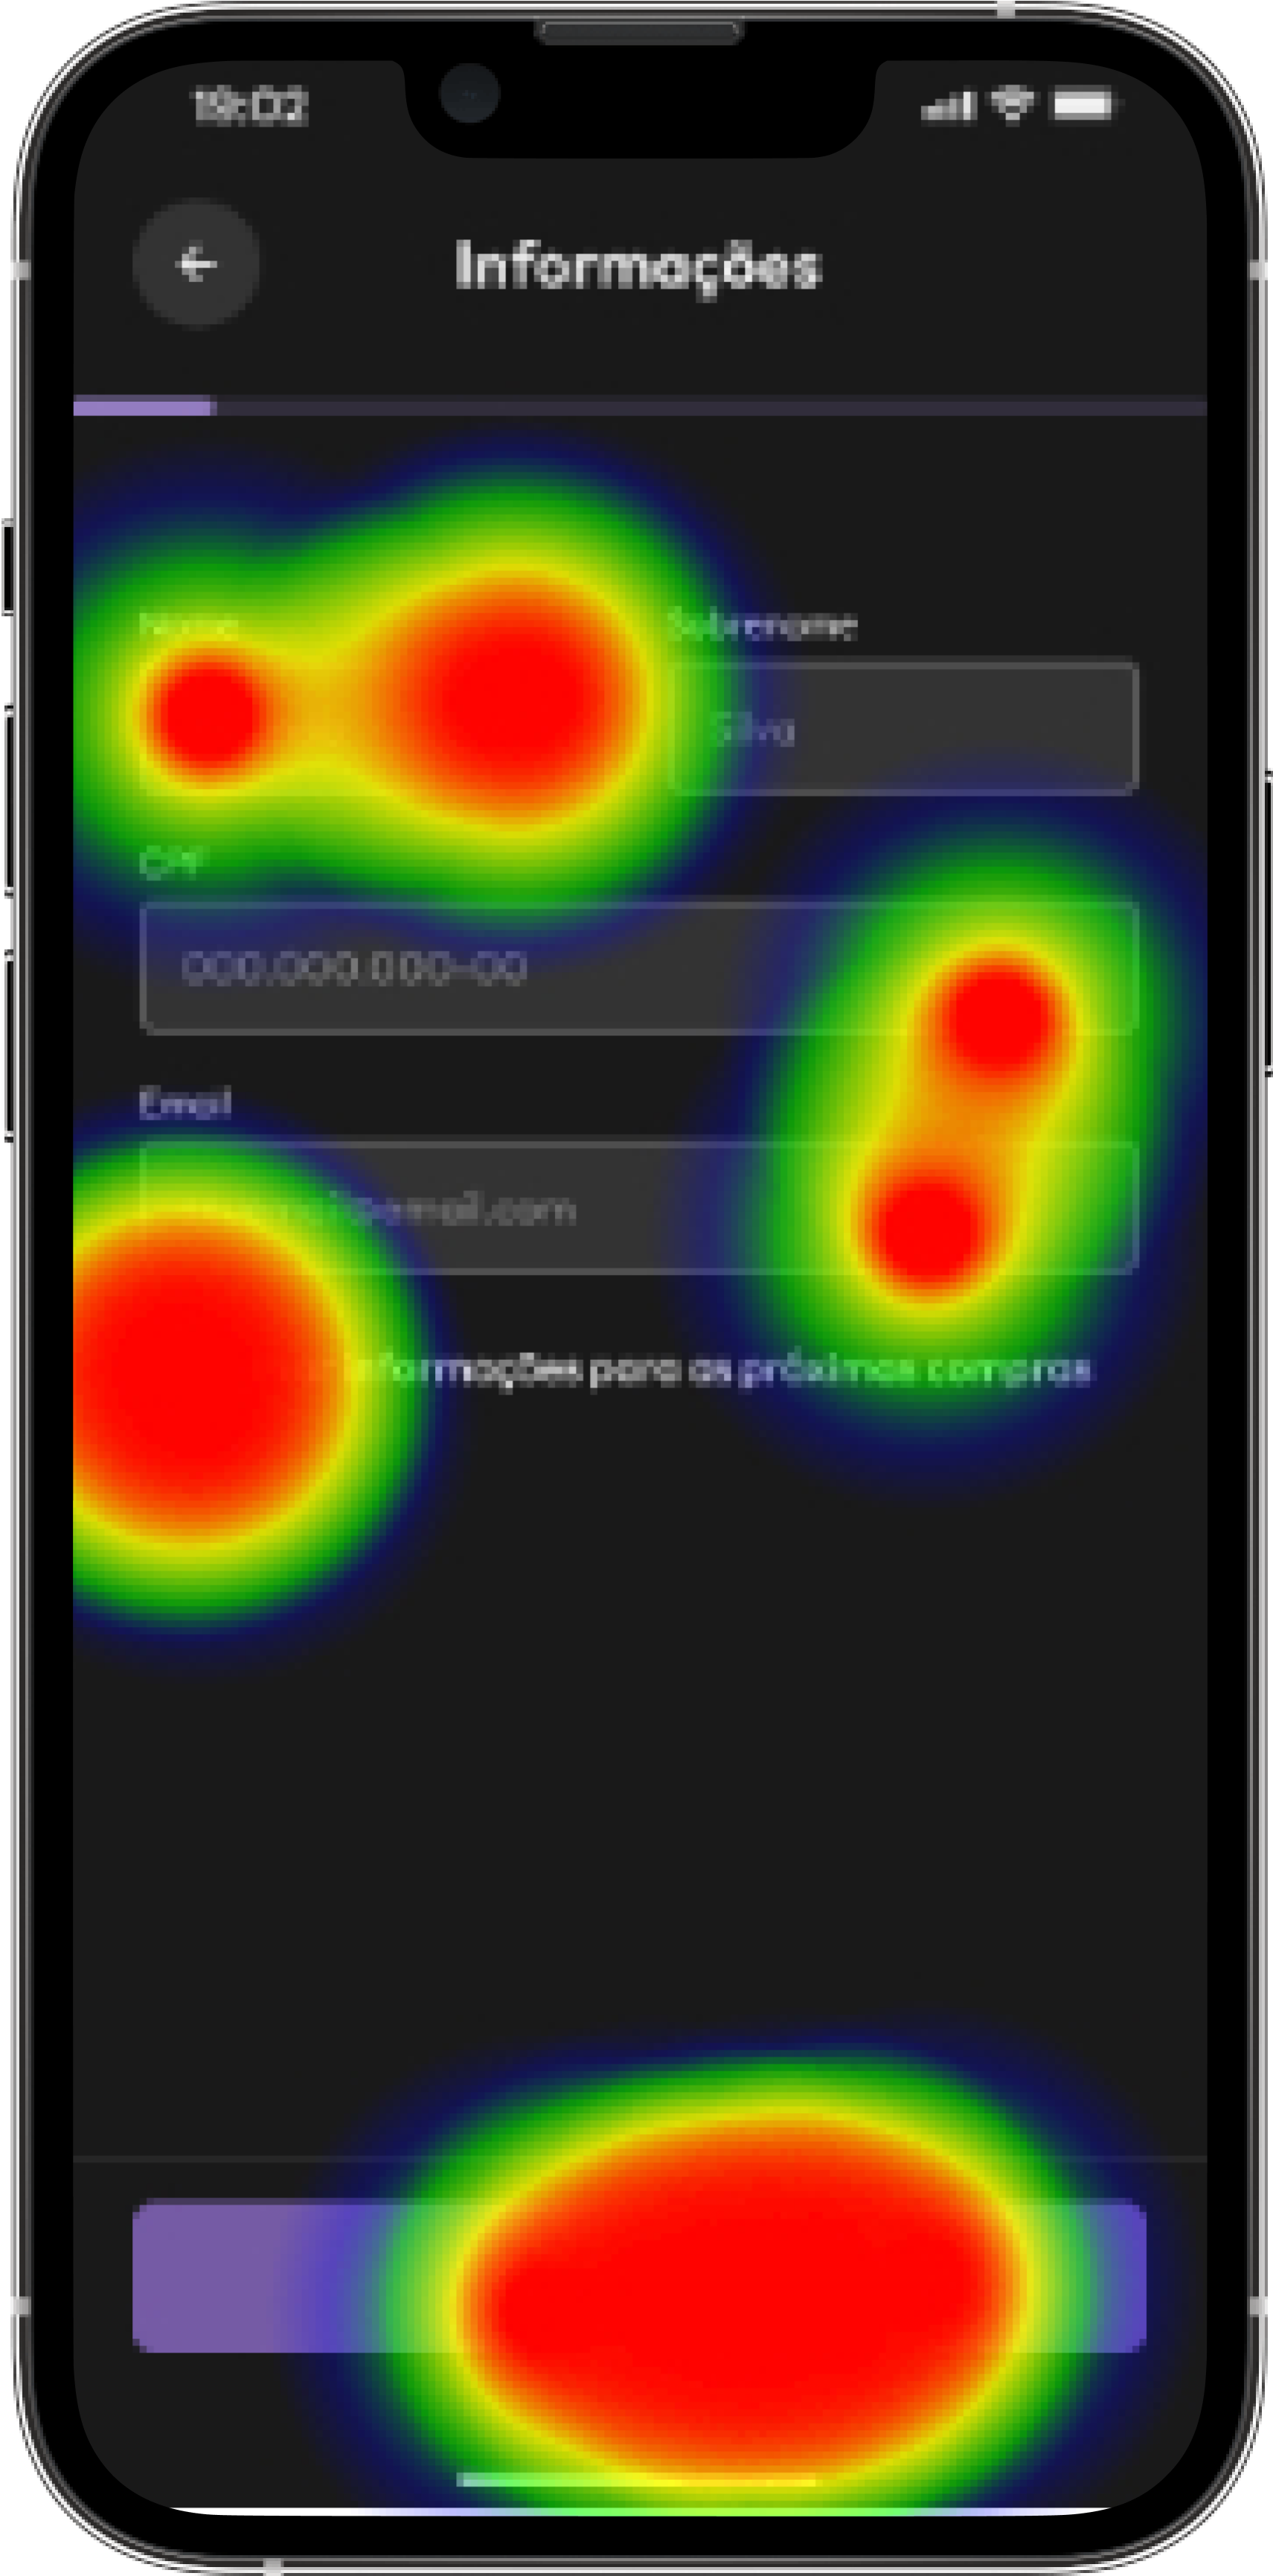
V1 heatmap
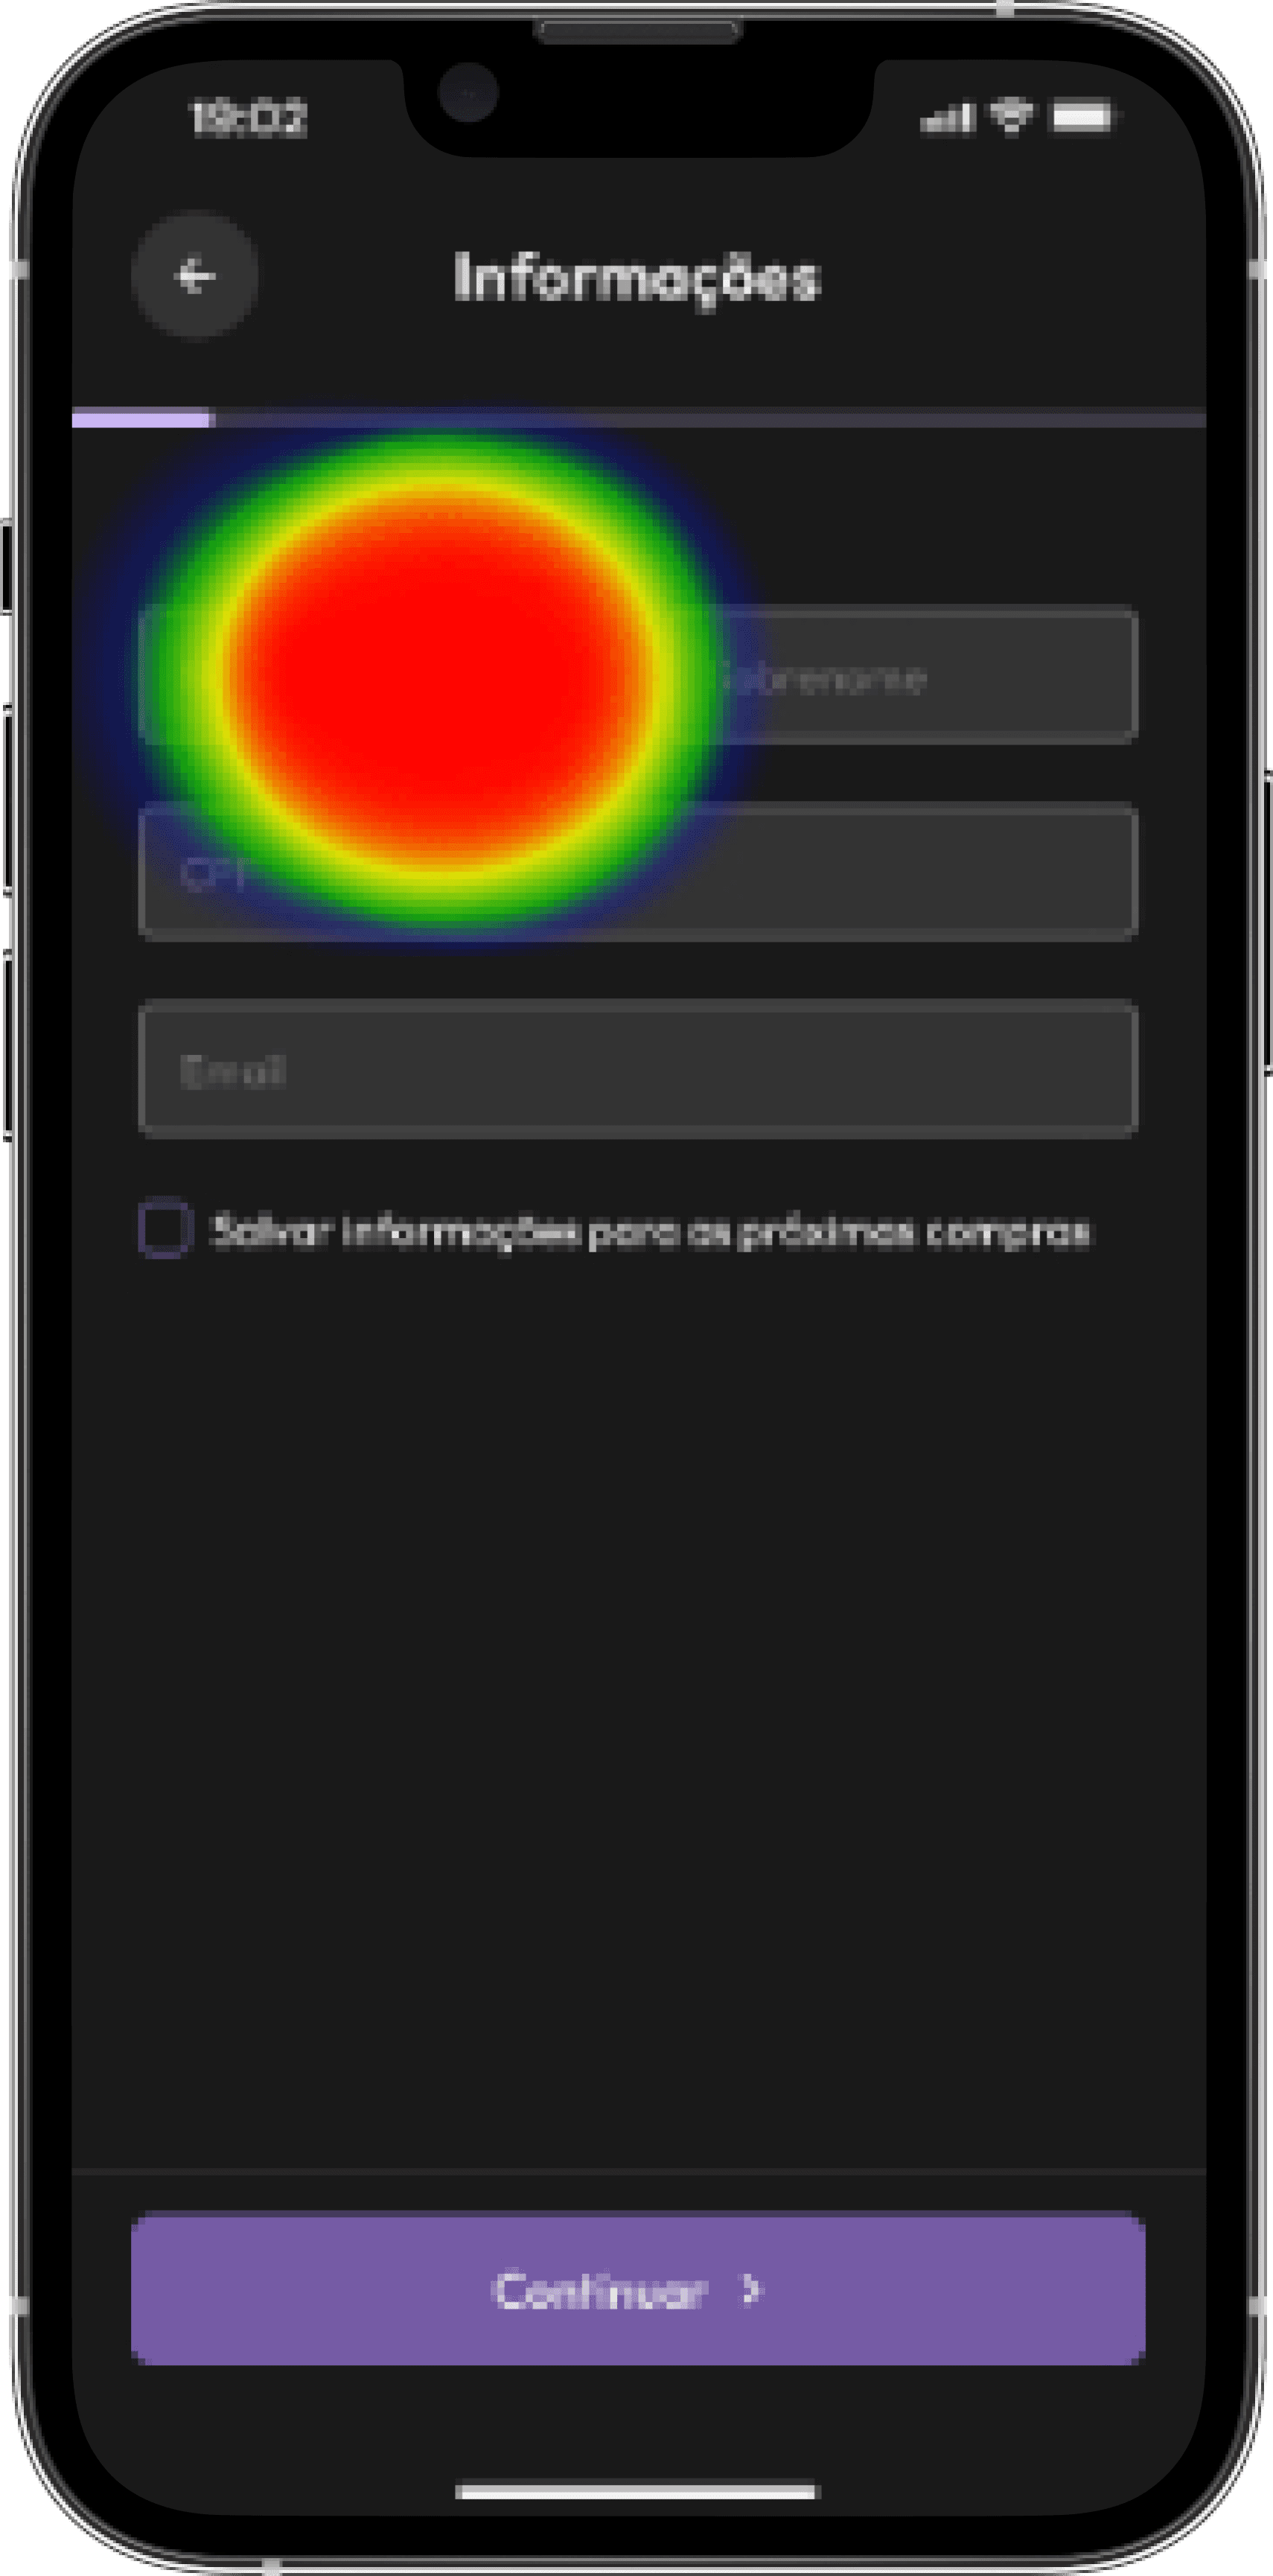
V2 heatmap
V1 heatmap
V2 heatmap
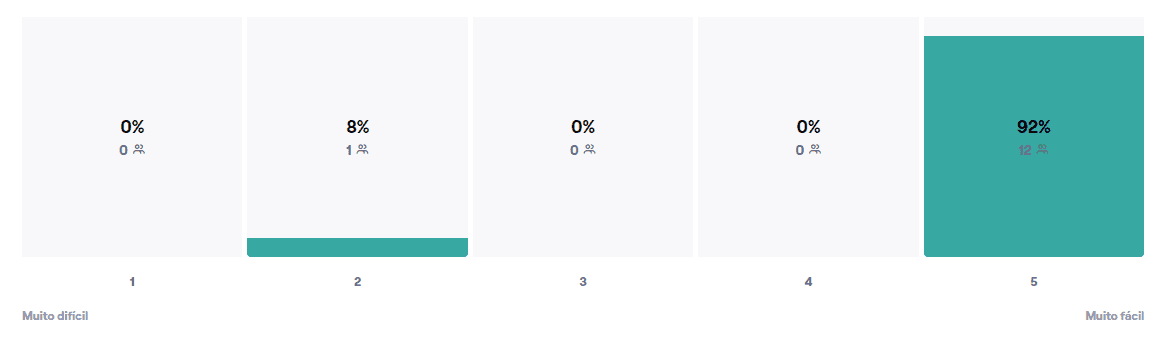
Based on user feedback and the difficulty rating for this task:
On a scale from 1 to 5, how easy or difficult was it to complete this task?
Task success rate
The task success rate was 76.9%, which was considered satisfactory given the difficulties found during the flow.
Drop-off rate
The drop-off rate was 23%, which was considered satisfactory.
Time on task
The average completion time was 1 minute and 7 seconds, a satisfactory result considering that participants did not enter real personal or credit card information.
Task 2B — Finding the ticket
Findability: The user needs to find the ticket they just purchased and add it to Google Wallet to complete the task.
Task 2B heatmap
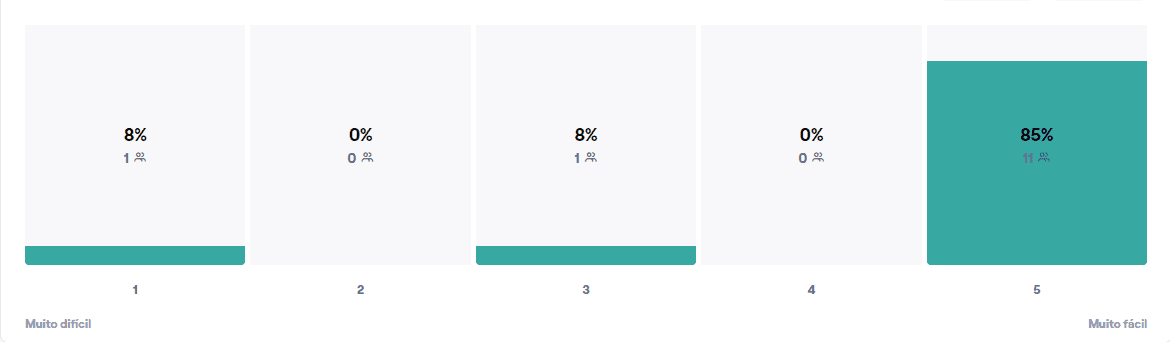
This task was completed successfully.
Based on user feedback and the difficulty rating for this task:
On a scale from 1 to 5, how easy or difficult was it to complete this task?
Task 3 — Changing location
Findability: The user needs to find the location setting and change their current location to Rua das Flores.
How easy or difficult is it to find this option in the app?
Task 3 heatmap
Key issues
The two screens with the highest misclick rates were:
Profile: Some users selected “My details.”
Location: The location screen caused some confusion because users could not clearly distinguish their current location or understand how to change it.
Improvements
The location screen now displays the user’s current location. They can use the search bar to find and select a new address, then choose “Change location” to confirm.
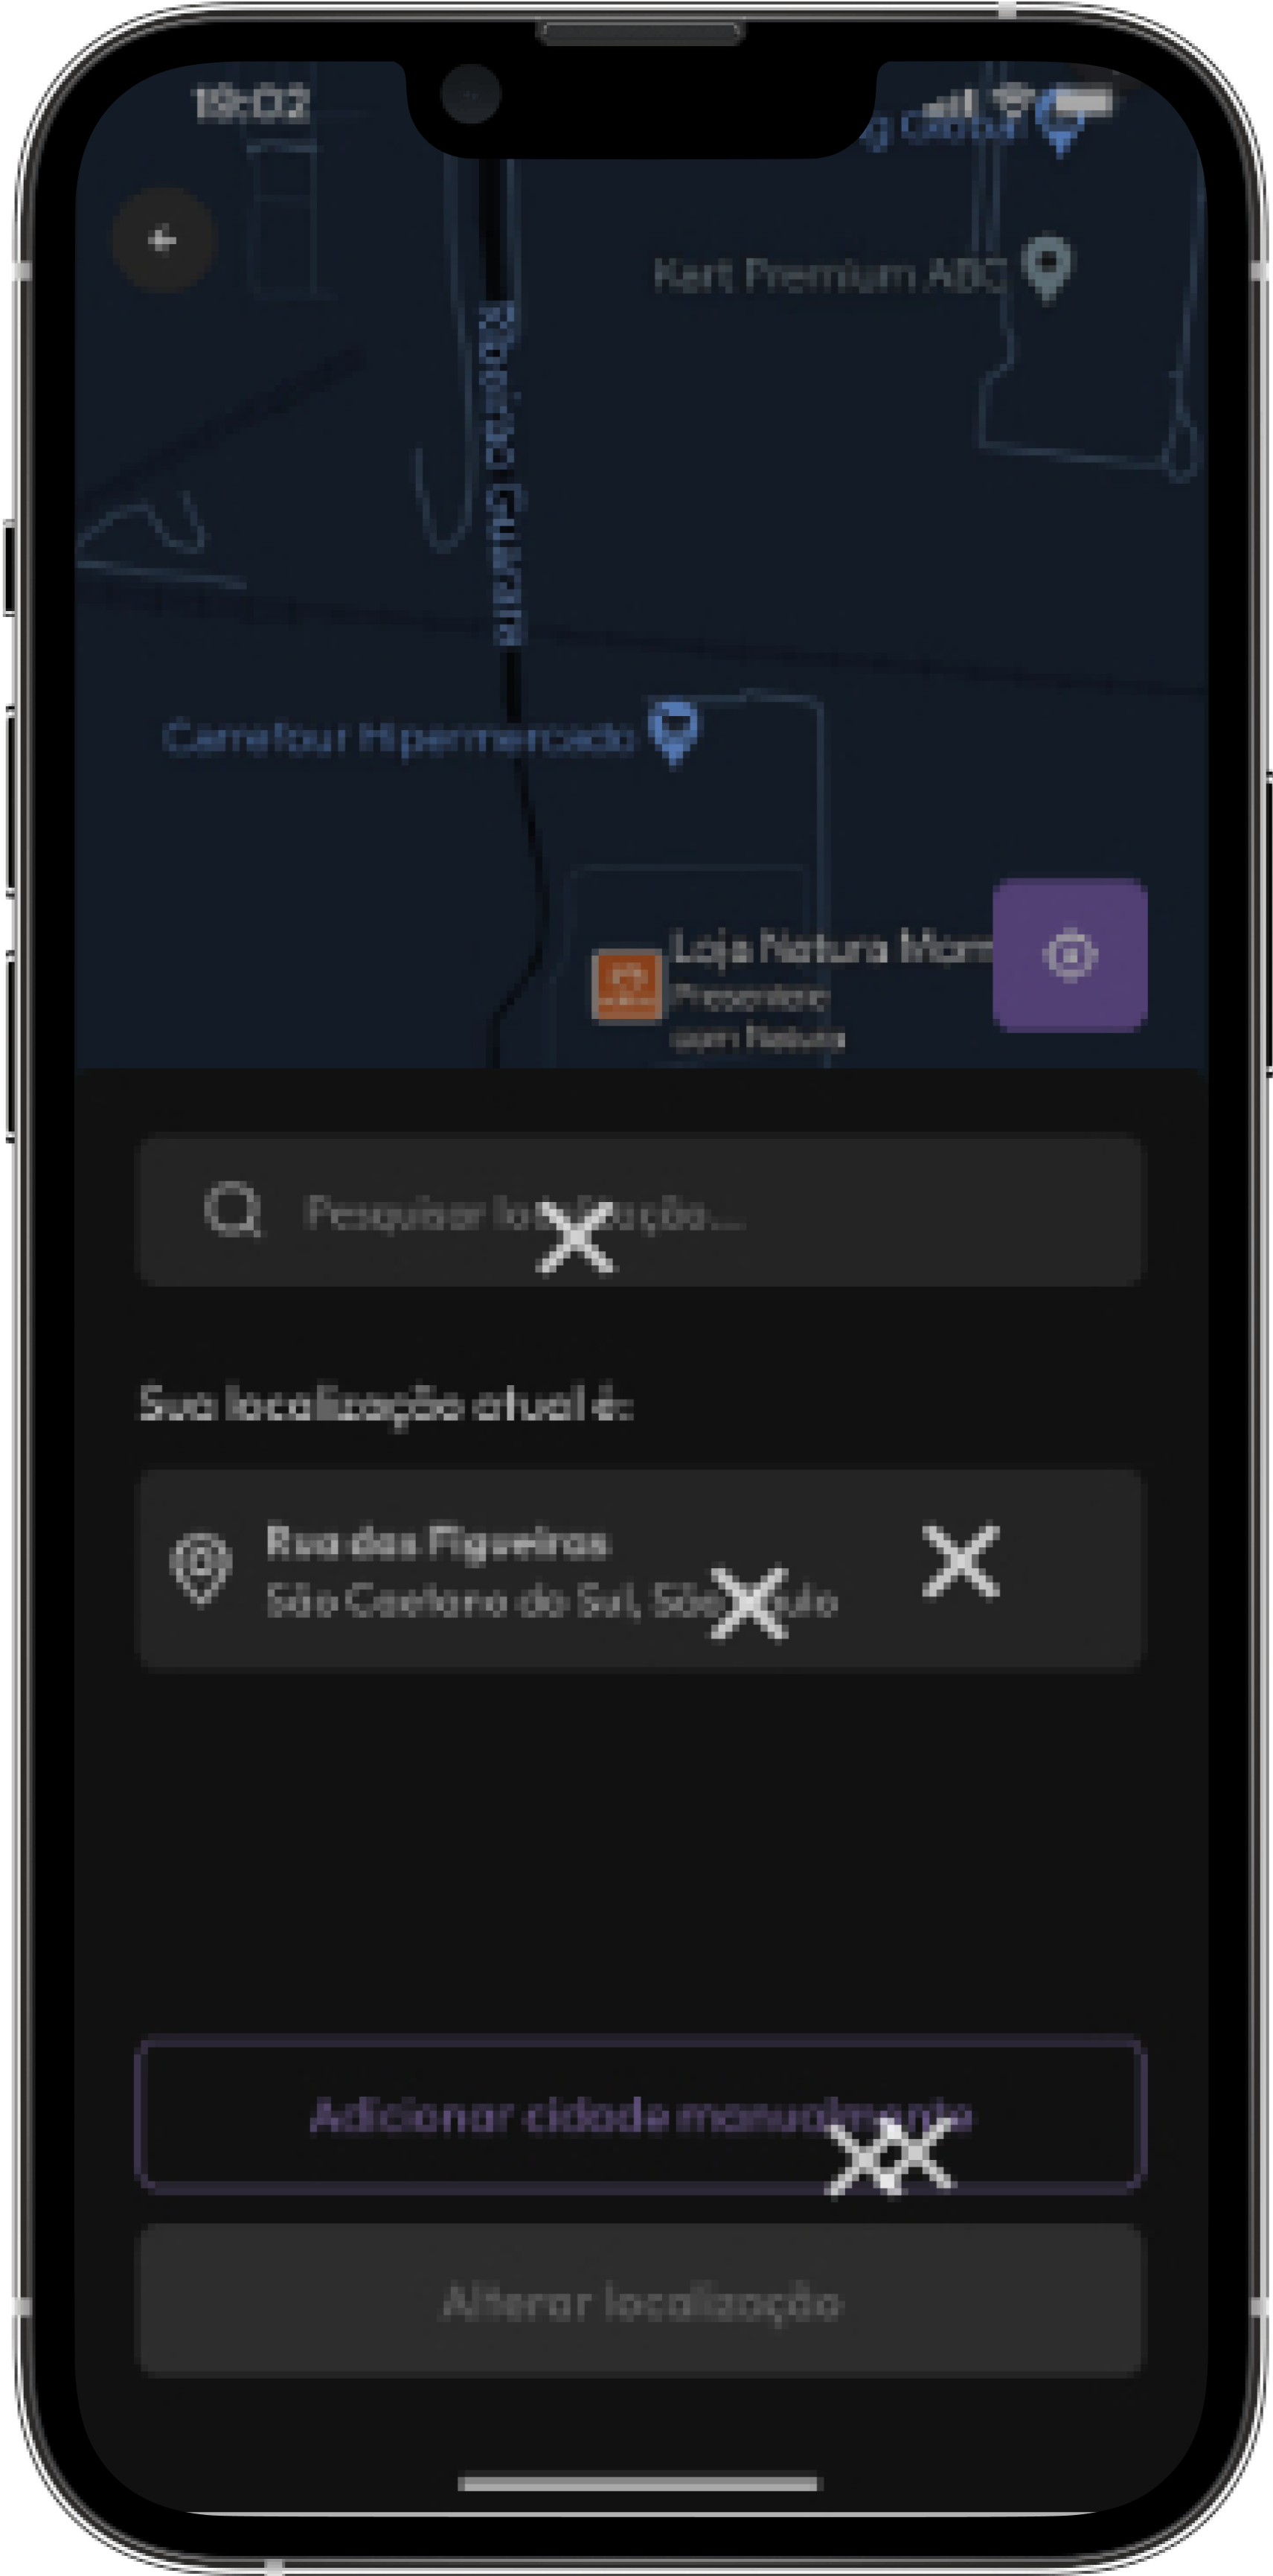
“Current location” screen heatmap
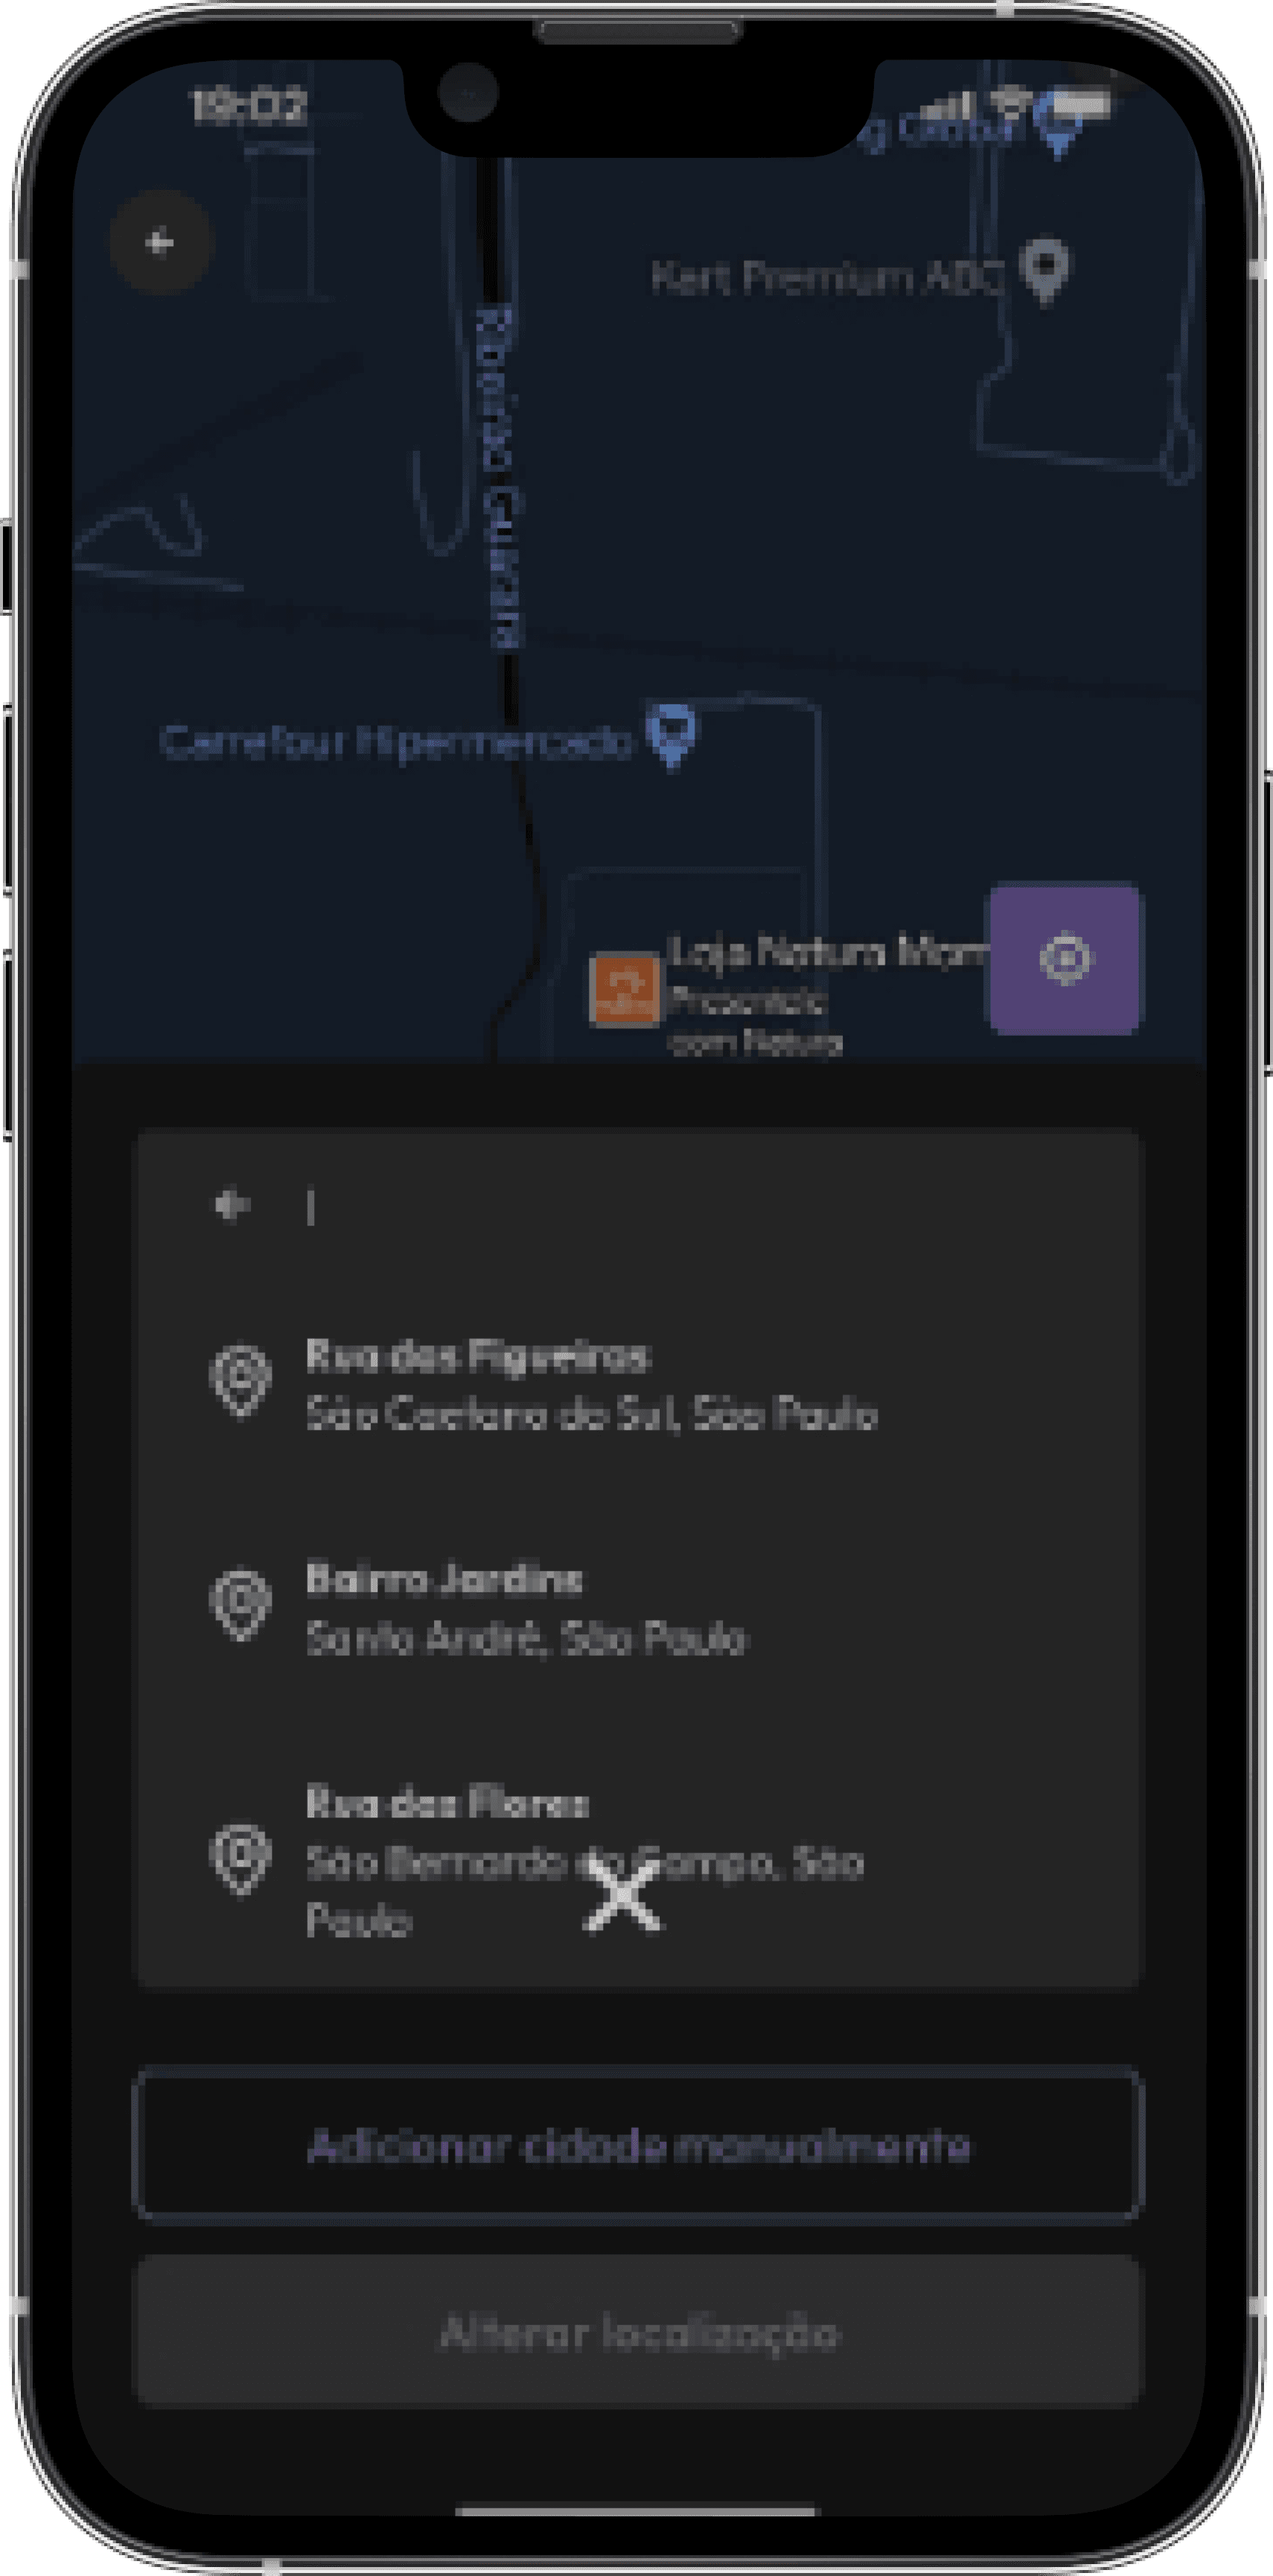
Search screen heatmap
Task success rate
The task success rate was 92%, an excellent result given the difficulties found during the flow.
Drop-off rate
The drop-off rate was 7%, which was considered an excellent result.
Time on task
The average completion time was 30 seconds, an excellent result.
Key takeaways
Conducting usability tests and iterating on the product is essential. It allows us to uncover obstacles, make adjustments, test again, and gather valuable insights for the product’s development.
“Making mistakes isn’t the problem. The problem is not knowing something is wrong.”
Next project

© Andressa Mendes 2026. All Rights Reserved